INTRODUCTION
In an attempt to better understand the structural-geological expression of bolide impacts on terrestrial planets, I devised and ran a set of experiments to investigate the spherical geometry of shattered, brittle silica by firing a steel pellet from a .177-caliber air pistol into small, clear glass balls of 60 millimeter (mm) diameter. The goal was to impart and characterize brittle fracture patterns in a silica sphere to study the geometry of fractures and faults stemming from oblique impacts at different incident angles, with 90o being normal to a spherical surface, and 1o nearly parallel to it. For the purposes of this study, oblique impacts are characterized in groups having high (61o - 89o), moderate (31o - 60o), and low (1o - 30o) incidence angles.
For comparison purposes, the diameter of the ball (0.00006 or 6e-5 km) is about 200-million times smaller (2*10-10) than Earth (~12,742 km). The impacts were produced using a Crosman American Classic Model P1377, .177-caliber air pistol that fire a projectile of 4.5 mm diameter (fig. 1). The P1377 operator's manual lists a velocity of 183 meters (m) /second (s) for 10 pneumatic pumps, and warns of accelerated wear to the unit if it's pumped more than that during its use. By rounding up to ~ 2 m/s for comparison purposes, hypervelocity strikes on planetary surfaces like Earth and Mars can occur over 10,000 (103) times faster, in the range of about 30,000 m/s (30 kilometers (km)/s).
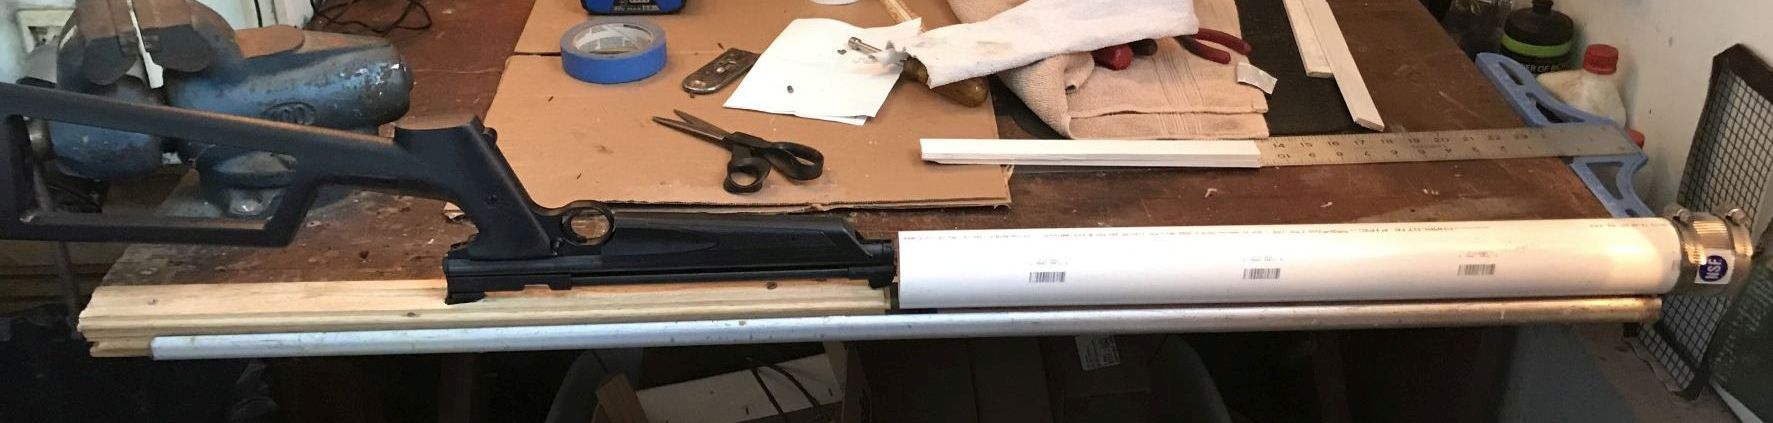
Figure 1. A Crosman air pistol was used to fire a steel pellet into 60 mm clear glass balls at high- to low-angle trajectories. The jig pictured above was first used for calibration and testing before a subsequent, more stable one was crafted. Crosshairs were marked onto each ball that was centered in the PVC tube before each shot.
The 60 mm-diameter glass balls were purchased from an internet outlet and marketed as "Transparent Quartz Clear Magic Crystal Glass Healing Ball Sphere Home Decoration". They have no visible impurities, and cost a little over $11 each. A total of ten balls were purchased in two lots, the first for set of 5 was used in Test 1 and Run 1, and 5 additional ones were subsequently purchased for Run 2 and Test 2 once a more secure test apparatus was devised and implemented. The pistol was attached to a Model 1399 stock to improve handling and alignment of the gun (fig. 1).
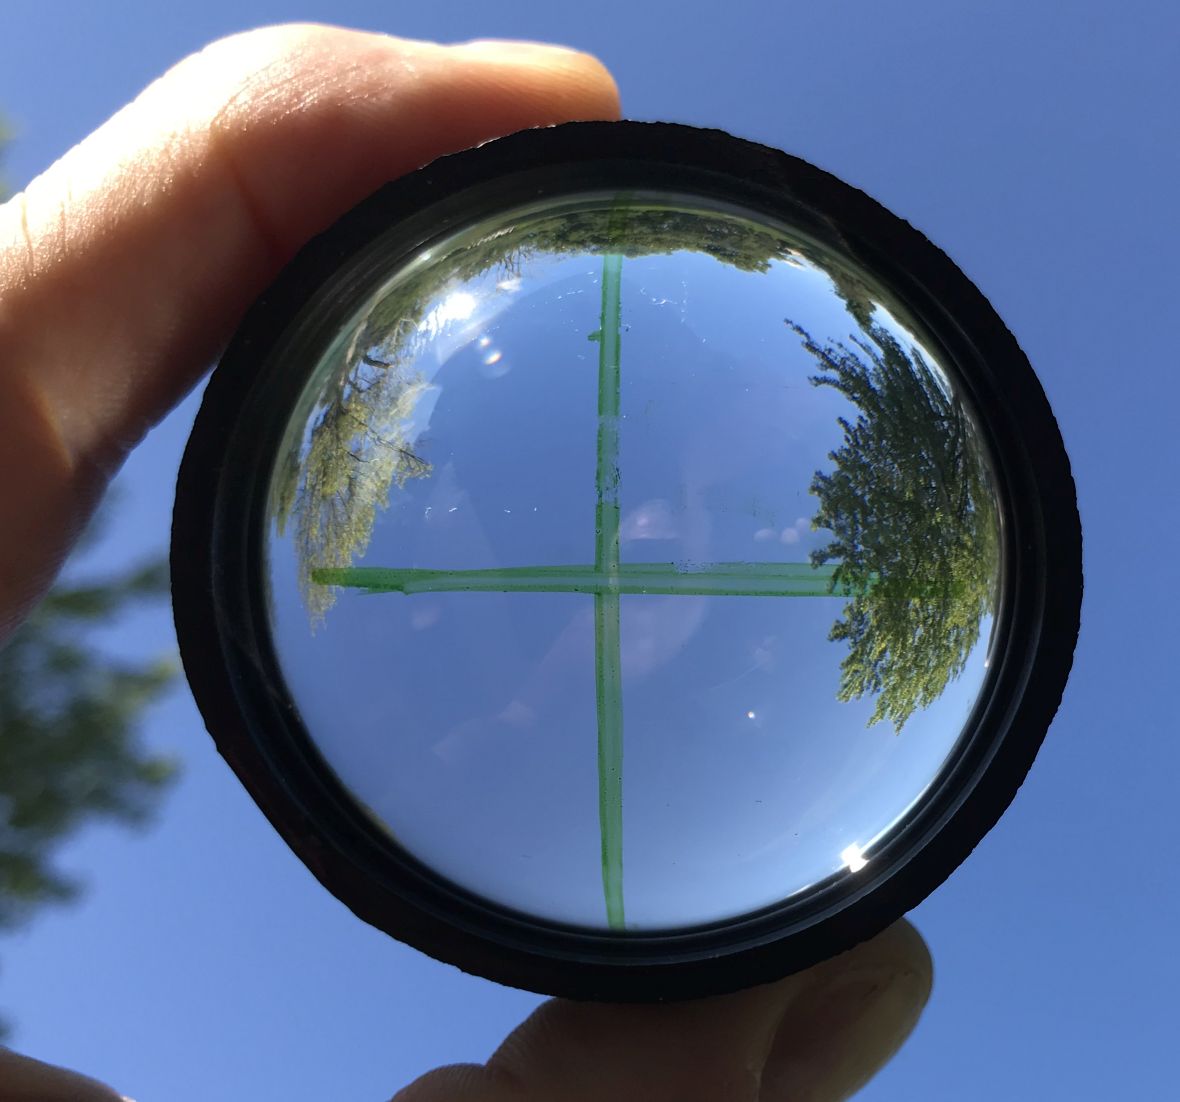
For the first tests (TEST 1) and subsequent set of impact experiments aimed at characterizing the strain fields resulting from different incident angles (RUN 1), a test jig was manufactured that stabilized the gun to aim at a 60 mm glass ball with one side facing the gun barrel through a 24"-long PVC pipe of 2" inside diameter that catches ejecta for collecting and saving. A 24"-long piece of an oak hardwood, tongue-and-groove floor plank was used to mount the pistol upside down and in line with the tube center as pictured in figure 1 . Two custom notches were reamed and sanded into the wood strip to hold the sights of the gun when mounted upside down. The wood base and PVC pipe rested in the gutter of an aluminum, U-shaped pencil tray attached to my workshop bench top (fig. 1). A glass ball was first secured into one-half of a rubber gasket that was part of a purchased 2-inch-diameter steel clamp that was customized to secure the ball inside the end of the PVC pipe and facing the gun (fig. 2). The approximate center of each ball was marked with a dot or cross hairs prior to each shot, and the gun manually held in place during shots by applying hand pressure.
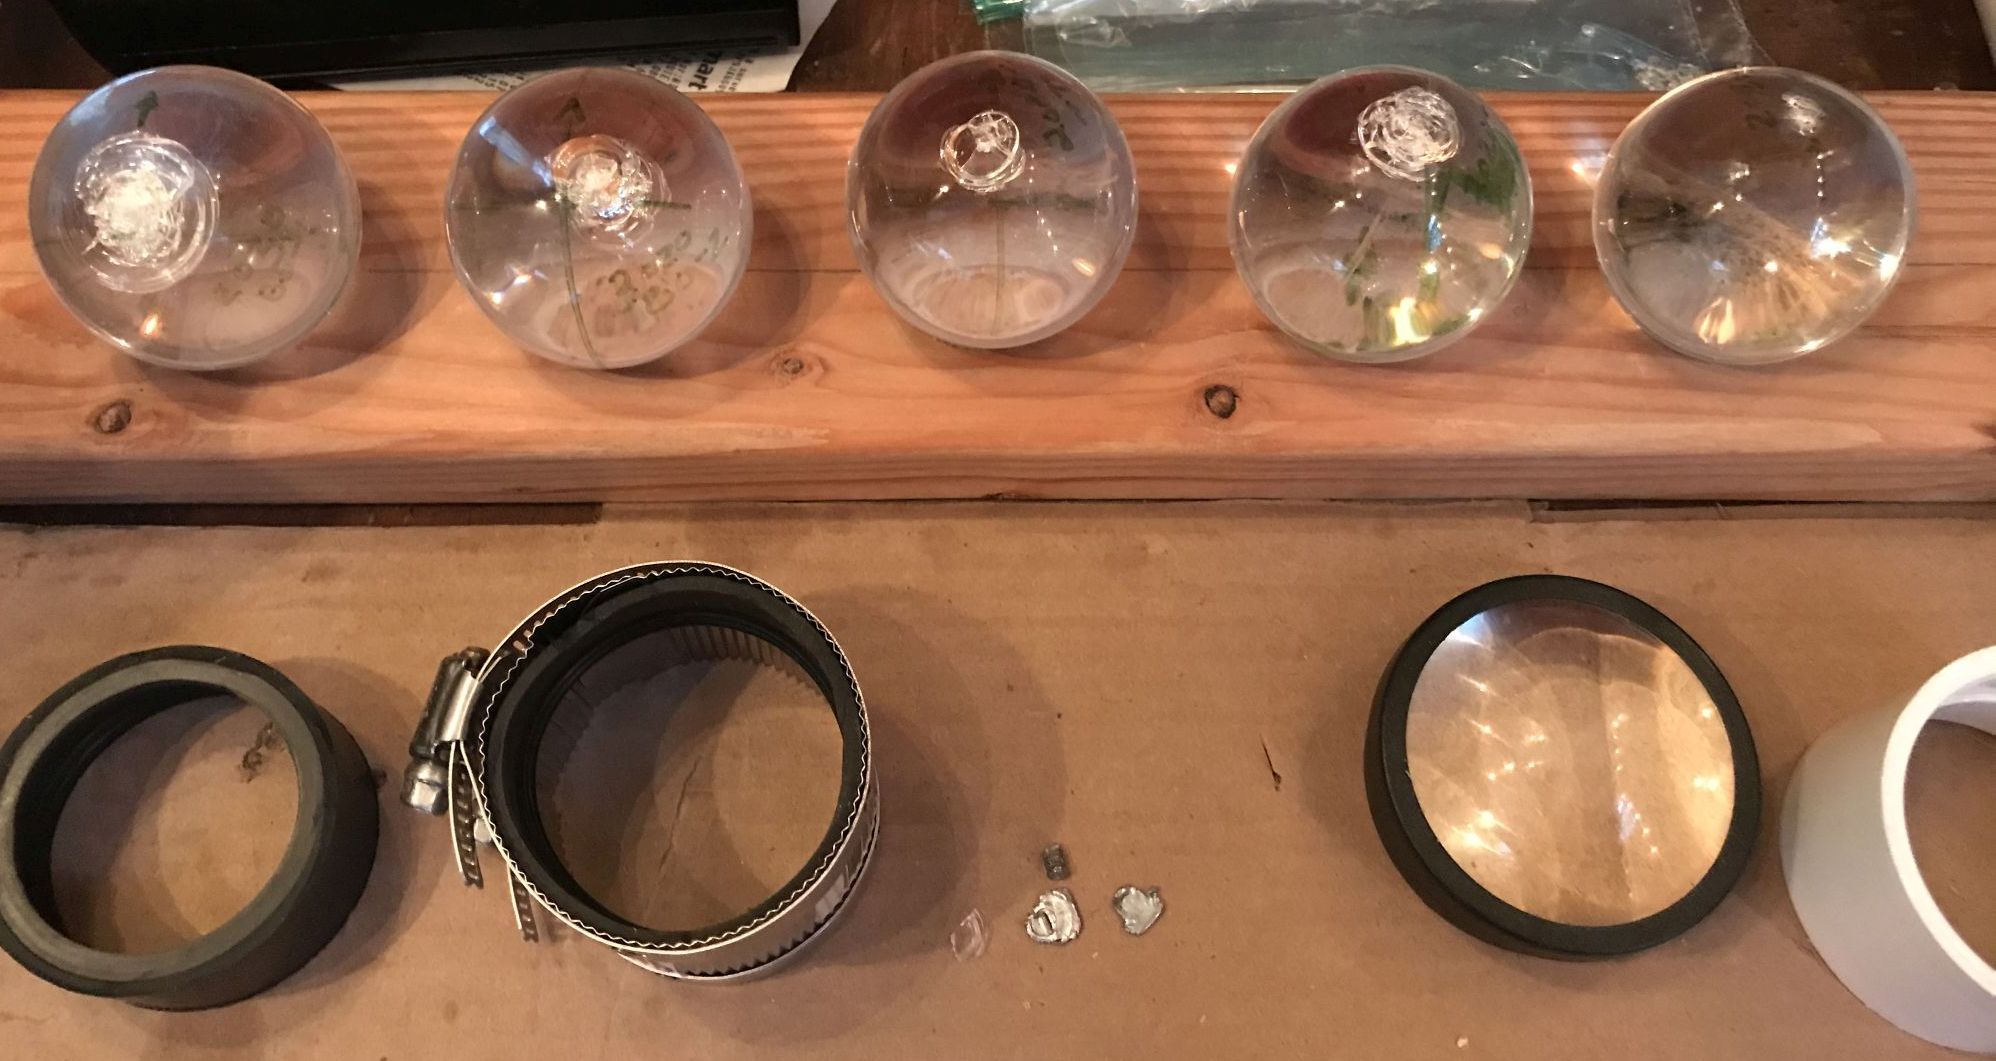
Regular, lead pellets were first fired into the center of a ball to gauge the results from using 12 pumps pressure. The pellets simply flattened against the ball leaving no visible blemishes (fig. 2). Next, a 6 mm - long tip of a case-hardened steel screw was then cut and filed to fit snugly into the gun barrel. A test shot produced a visible strain field, so the experiments commenced using the fashioned steel projectile (fig. 2).
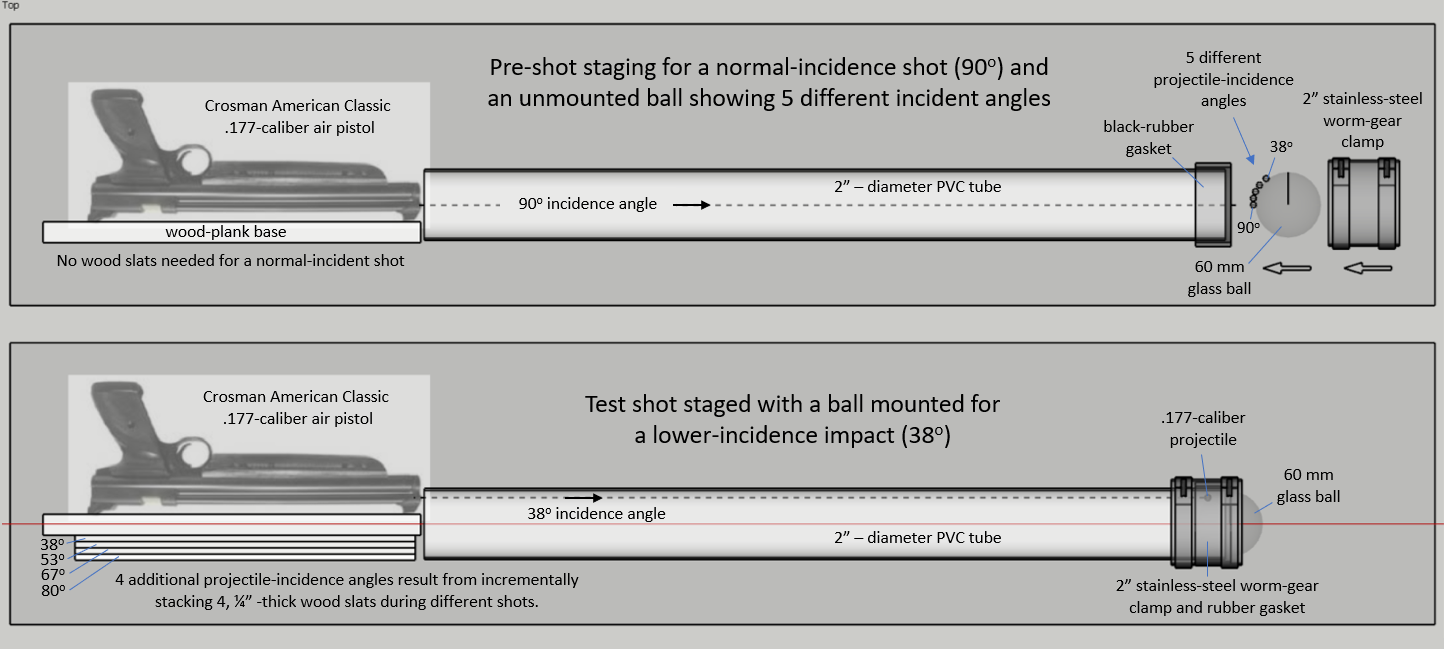
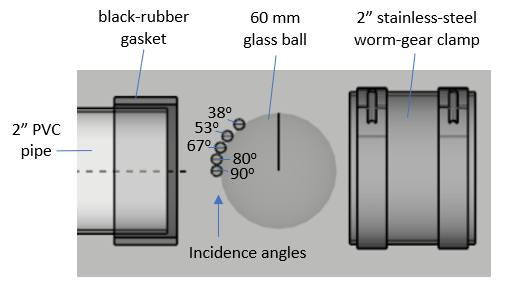
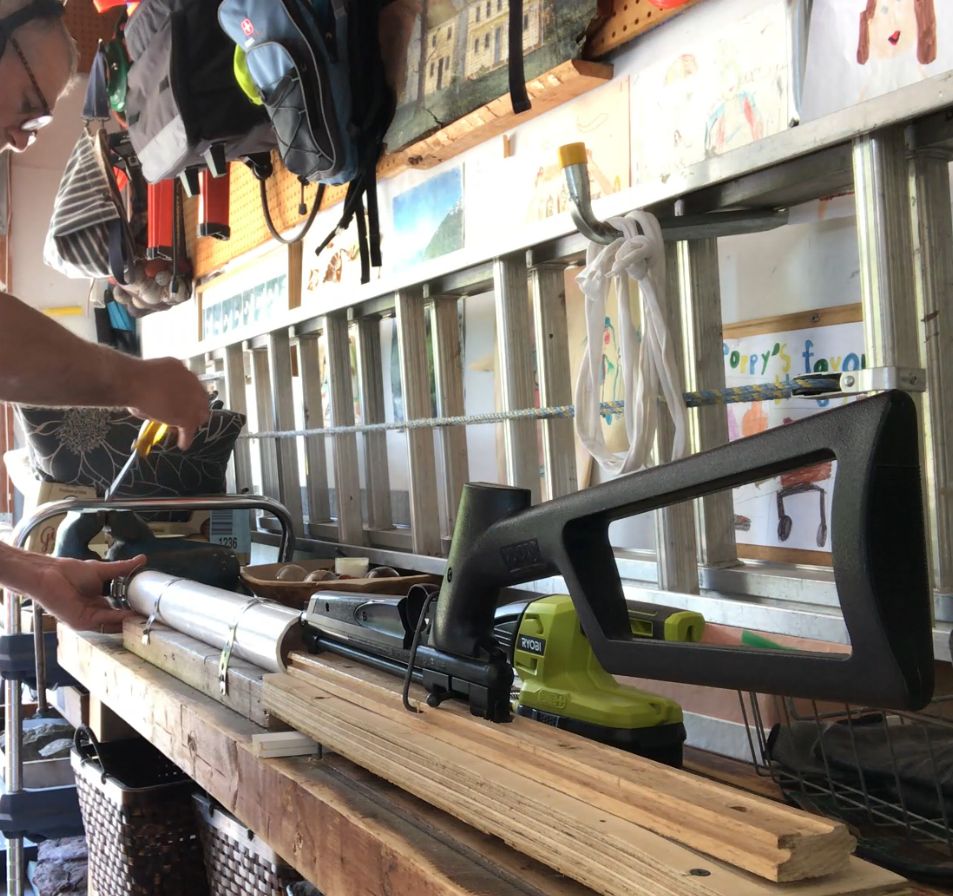
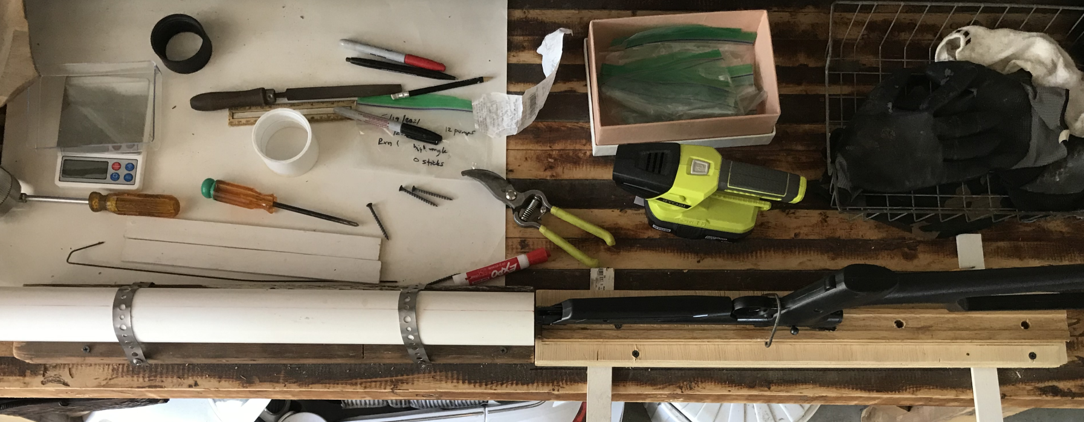
Figure 3. SketchUp renderings of the test stage showing the upper- and lower-most firing positions resulting from using 1/4"-thick sticks to incrementally raise the gun for successive test runs. Each stick provided about 14o of additional impact obliquity for incident angles ranging from 85o to 38o. Photographs shows the improved test apparatus used in RUN 2 and TEST 2. The three sticks used to raise the gun results in the ~53o incidence angle. This arrangement resulted in more-precise targeting.
RUN 1 was a series of 6 shots into 5 different balls. One ball was repeatedly used for a set of three, low-incidence impacts because of the relatively small size of the associated strain fields. Each shot used 12 pneumatic pumps and the same steel pellet, but with varying incident angles reflecting the consecutive raising of the gun height 1/4" each time after inserting additional flat, wood sticks beneath the base (fig. 3). The different heights correlate to calculated incidence angles of 90o (vertical), 80o and 67o (high), 53o (moderate), and 38o (low; fig. 3).
Because of the hand-stabilized mode of operation for the first set of shots, and the resulting lack of precision in hitting the target squarely, I devised a more secure jig for a second test run (TEST 2) and set of shots (RUN 2). The tube and base were fastened securely to a wooden-bench top using clamps to firmly hold the gun in place (fig. 4). The tube and gun were clamped into place using 1/2"-wide galvanized strapping for the tube, and a customized metal rod bent to wrap around the gun with both ends secured into the plank groove and beneath the ribbed tongue on the opposing side (fig. 3).
TEST 2 used a new glass ball and the same steel projectile, but was pumped 15 times to push the impact-velocity towards the maximum that the gun provides. The more-stabilized apparatus resulted in improved aim, such that when the gun was aimed at the ball center for a 90o (normal) incident strike, the projectile hit the mark at about an 85o angle. Although not perfect, this test produced some rather unexpected results that are detailed below. RUN 2 afterwards commenced using four new glass balls consecutively staged and incrementally raised between shots to produce strain fields reflecting the various incidence angles as characterized in .
RESULTS
The resulting impact scars were photographed and traced with two-dimensional polylines and polygons using SketchUp 2020 software. A photograph of each impact strain field was taken, then downloaded and imported into the software and saved in the project file (*.skp). Fractures and faults were mapped based on their visible appearance in the photographs using polylines, and the polygon areas of the respective strain fields were automatically calculated by the software and recorded in square centimeters in table 1. MS Excel statistics operations were run on the scatterplot to determine the best -fit regression curve to mathematically characterize the charted relationships. The best-fit curve was a simple power relationship with the form x = 0.001y2, although the R2 coefficient was 0.524. This does not therefore representative a robust mathematical approximation and requires further testing to improve the statistical correlation, if in fact this is it. Nevertheless, it points to the possibility (and is generally intuitive) that the size of a bolide strain field is dependent upon the incidence angle of the projectile, when every other impact factor is equal. In other words, the absorbed ground strains are dependent upon incident angle, with normal impacts resulting in the largest astroblemes, and those of lesser incidence having proportionately less ground energy absorbed.
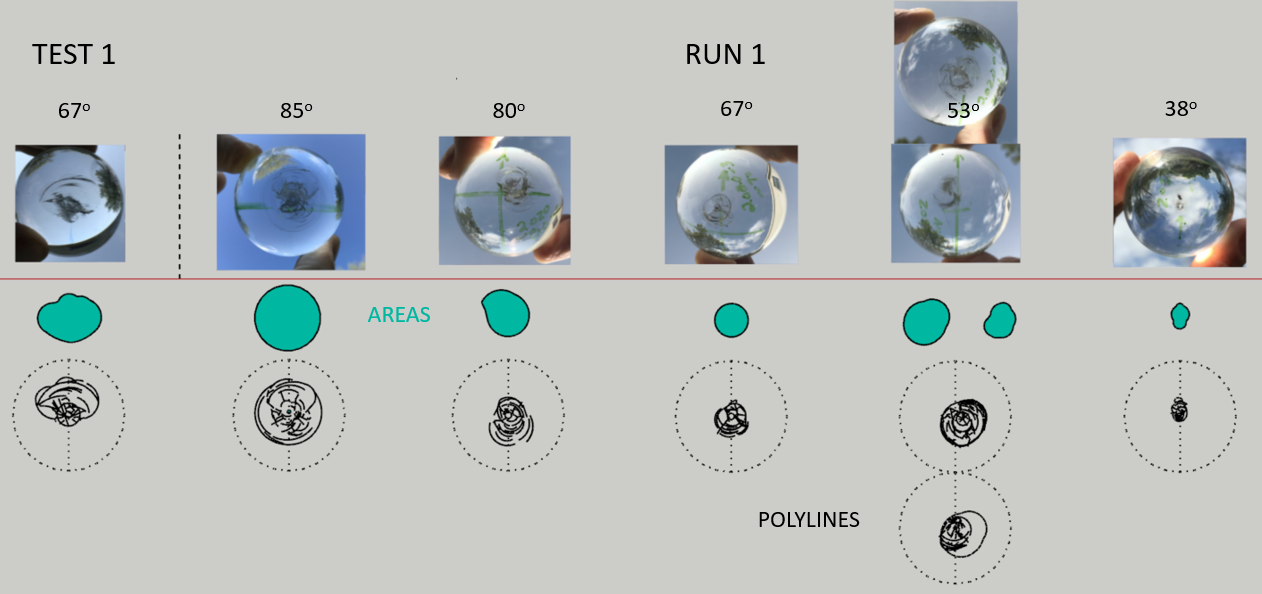
Figure 4. Results of TEST 1 and RUN 1. The resulting strain fields were digitized using SketchUp Pro software that also calculated the area of the respective strain fields. The green polygons are those used to calculate the areas and the black-line tracings beneath were used to statistically analyze the non-concentric fractures. Not all of the results from TEST 1 are included, but the lower one for the ~53o angle is from TEST 1.
The different sets of polylines traced in the first experiments were analyzed
with respect to their structural strikes using QGIS software ver. 3.10.2.
This software includes a nifty, custom plugin written and shared by Håvard
Tveite (NMBU) that plots circular, line-direction histograms (rose diagrams)
from vector themes (fig. 5). The plugin visualizes the distribution of line
segment directions as a rose diagram with an option of using weighted
line-segment lengths. Once all the polylines are traced in QGIS, the file is
exported as an AutoCAD drawing-exchange file having a *.DXF filename extension,
then opened as a vector theme in QGIS. The multi-part theme was then processed
into single parts that can be selected and subject to the circular-histogram
analysis. Because all of the strain fields had circumferential fractures lying
outboard form the impact point, my focus here was mapping and statistically
characterizing those not lying circumferential to the impact point (crater).
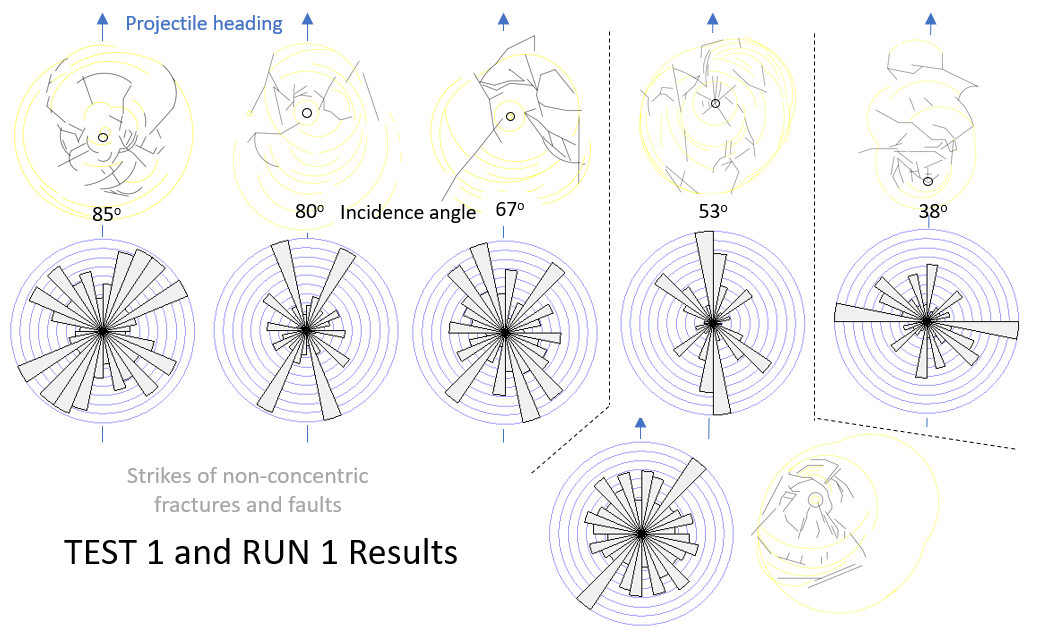
Figure 5. Results of TEST 1 and RUN 1 with circular histograms summarizing mapped strikes of non-circumferential fractures and faults by incidence angle.
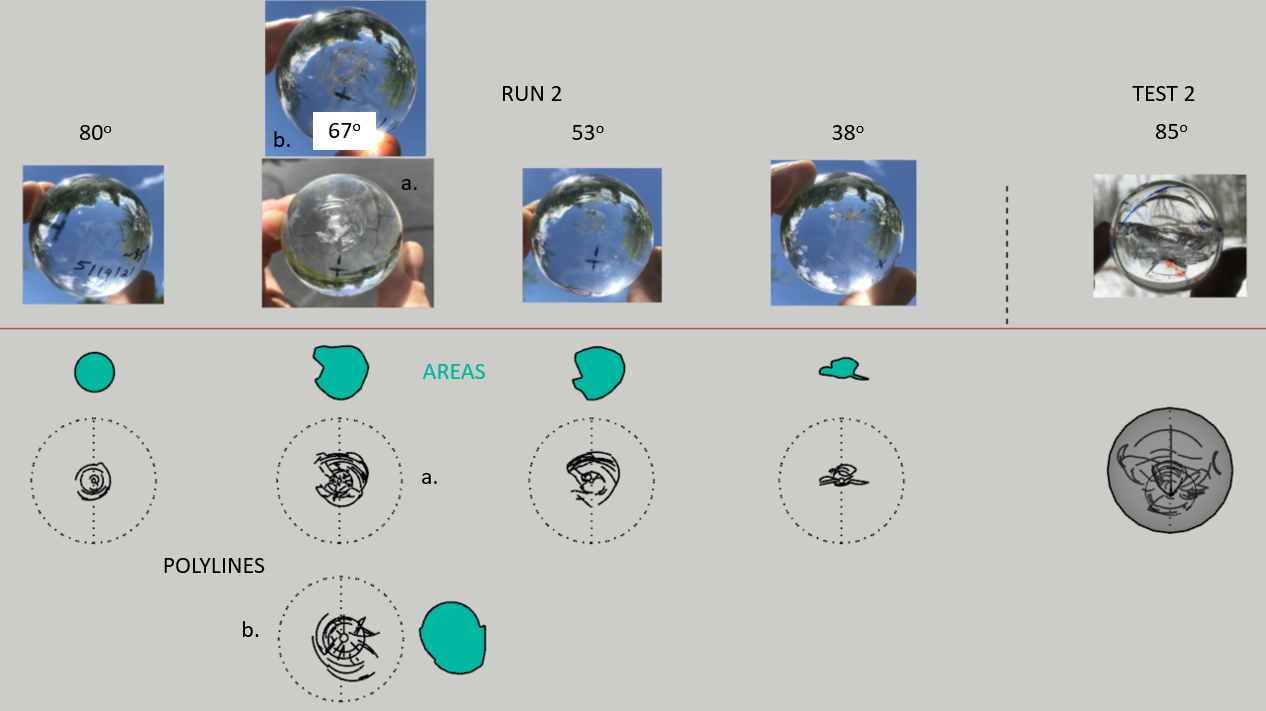
Figure 6. Results of RUN 2 and TEST 2. The resulting strain fields were digitized using SketchUp Pro software that also calculated the area of the respective blemishes. The green polygons are those used to calculate the areas and the black-line tracings beneath were used to statistically analyze the non-concentric fractures.
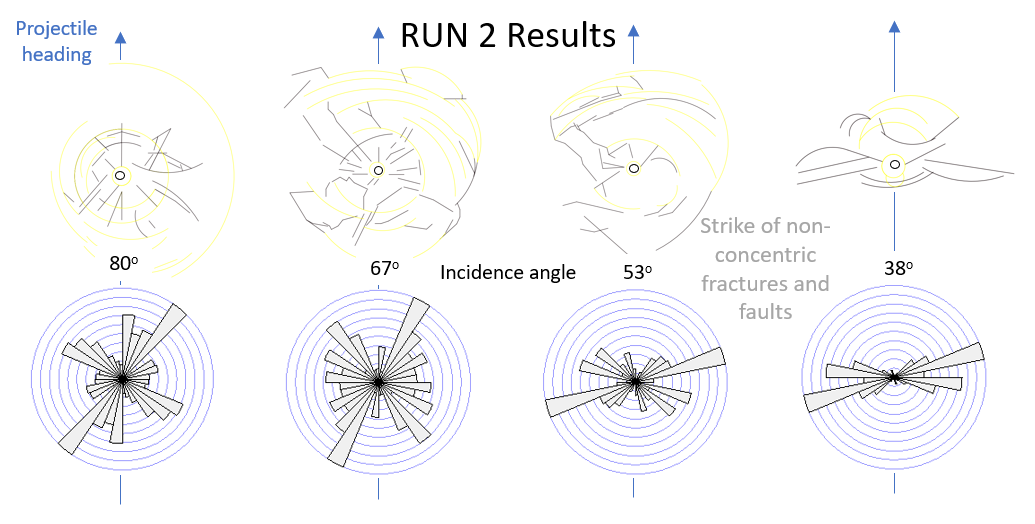
Figure 7. Results of RUN 2 with circular histograms summarizing mapped strikes of non-circumferential fractures and faults by incidence angle. Dark-gray polylines are those used in the rose-diagram analyses whereas the yellow lines lie in circumferential alignment.
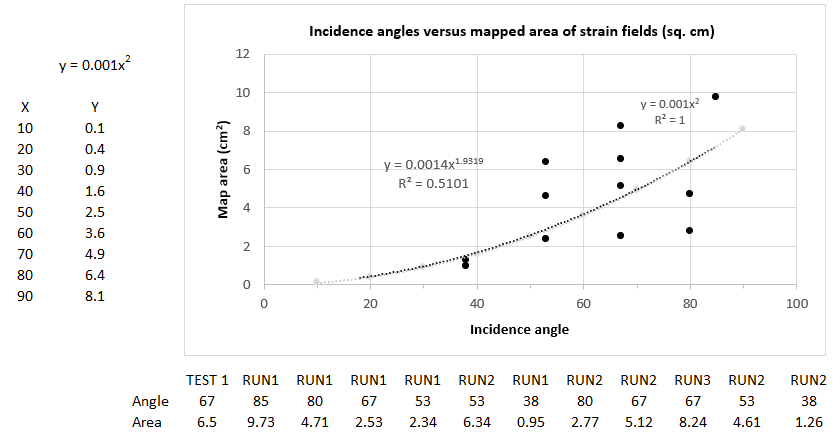
Figure 8. Charted test results of impact-incidence angle versus mapped area of associated strain fields. Although of wide scatter that will require more data, a power regression curve yields the statistically most accurate mathematical formulae describing the relationship between impact-incident angle and the mapped sizes of the associated strain fields.
DISCUSSION
There were no high expectations for this exercise at conception, but I am pleasantly surprised with the results. The experiment suffers from the use of a fabricated, workbench approach as opposed to a fixed laboratory setup like that at the gunnery facility at the NASA Ames research laboratory in Santa Clara County California. Experimental impacts into glass balls or layered, spherical targets at such a facility would be very insightful. With respect to the experimental results detailed here, even the second, clamped version of the apparatus produced slightly skewed shot results that required post processing in SketchUp to centralize and statistically characterize the fracture and fault strikes of the mapped strain field. This is apparent in the histogram analysis that relied on manual rotation of a few degrees of the traced strain fields before aligning them and charactering their mapped strain areas.
The mapped areas are best described statistically in term of a simple power function in the form of y = x2, where y is the mapped area of the visible strain area and x in the incident angle (>0o to 90o). As stated in figure 6, the correlation coefficient from the statistical analysis is poor because more experimentation is needed owing to the lack of apparatus precision and an insufficient number of experiments. Funding is also an issue because of the use of destructible media.
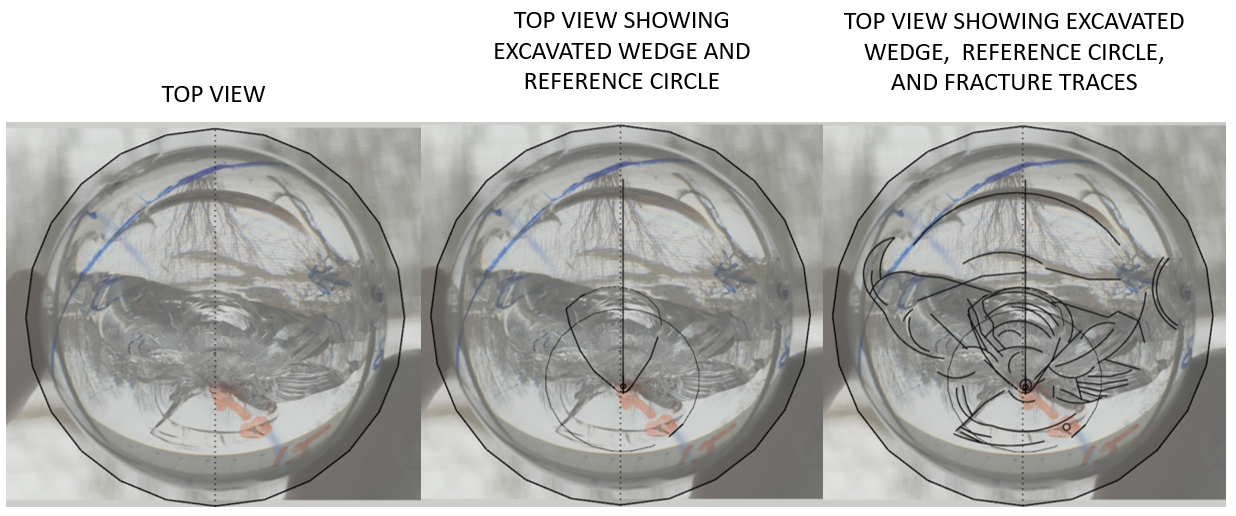
Figure 9. Mapped results of the strain field resulting from a high-angle impact (85o) near the gun's threshold velocity. The impact conditions were just right to produce a 3D foreland strain field that descends down toward the ball center from the impact point at the surface, then returns upward following an irregular path as further profiled in figure 8.
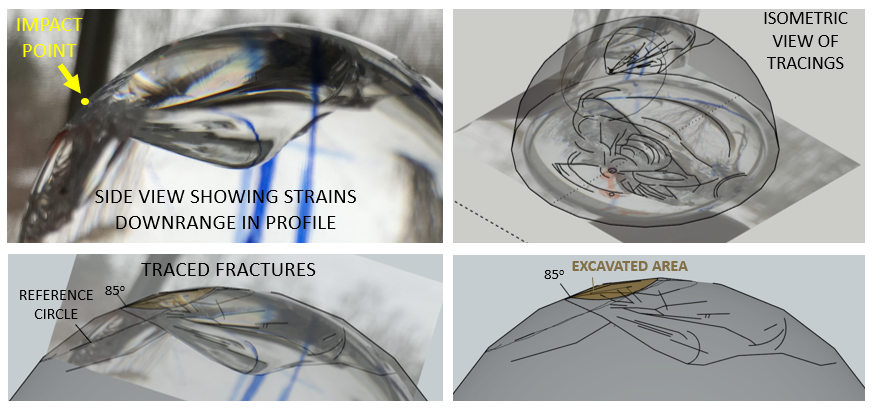
Figure 10. Test results showing a high-angle
impact near the gun's threshold velocity.
Three-dimension (3D) line tracings of spherical strain fields including the map
depictions in figure 7.
Some notable results from TEST 1 and RUN 1 include:
1) The non-circumferential impact fractures show conjugate, acute strikes of fractures that are either in line, or bisected by the projectile heading; that is, Anderson-type fracture behavior of Earth materials when brittle silica is suddenly stressed beyond its brittle-yield strength and shatters.
2) High-incidence impacts produced larger strain fields than lower-incidence ones (figs. 2 and 4), and
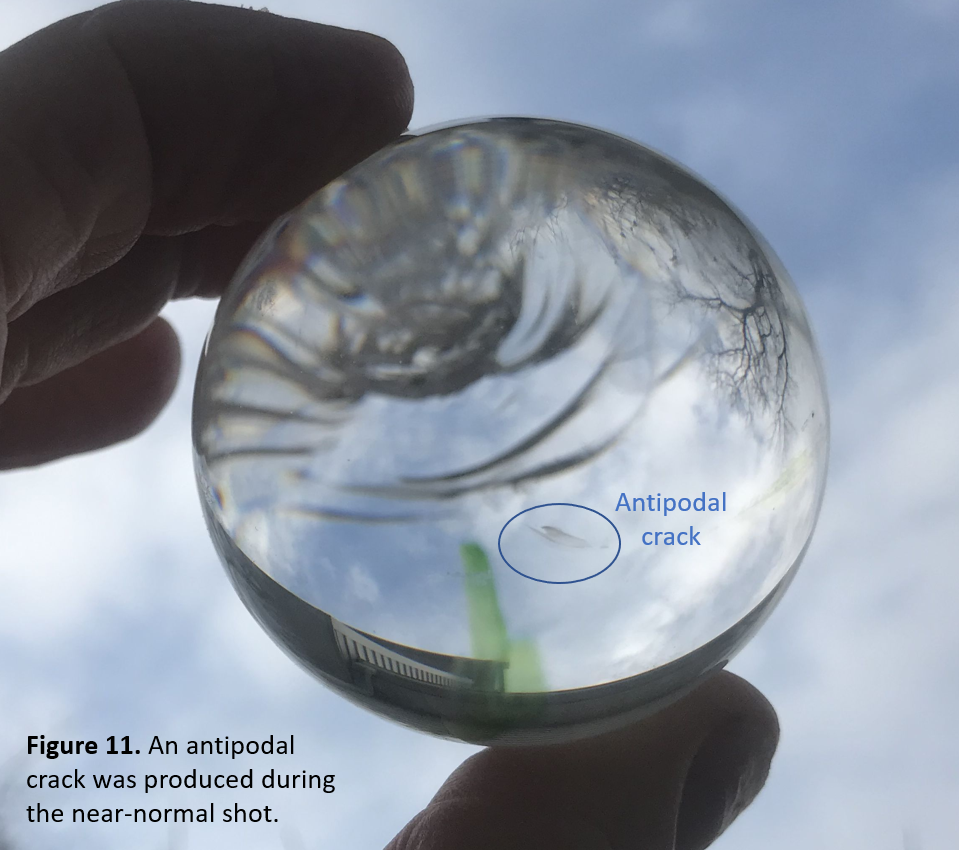
3) The near-normal impact is the only one that produced an antipodal crack and blemish on the opposing side of the sphere (fig. 11).
 As expected the strain fields lessened along with angles of impact incidence,
and there were characteristic, Anderson-type non-circumferential fracture
patterns produced like those seen in the recent
Martian astrobleme fracture
and fault analysis. The results of RUN 1 were encouraging enough to invest
in the second run.
As expected the strain fields lessened along with angles of impact incidence,
and there were characteristic, Anderson-type non-circumferential fracture
patterns produced like those seen in the recent
Martian astrobleme fracture
and fault analysis. The results of RUN 1 were encouraging enough to invest
in the second run.
The results of RUN 2 produced both anticipated and unexpected results including:
1) One strain field of a near-normal impact was smaller than the more moderate-angle ones,
2) The two 67o impacts produced varying strain fields with one displaying more concentric fractures up range than the other, and the second showing more downrange strain.
Both of these apparent anomalies likely stem from the lack of precision of experimental controls. But as for the same with the first tests,
3) Moderate-angle impacts produce Anderson-type conjugate fracture systems in acute arrangement to the projectile heading.
4) Low-angle impacts can have pronounced lateral effects in comparison to up range and downrange ones relative to the projectile heading.
The details of the penetrative, 3D strain field produced from TEST 2 are captured in figure 10. I didn't imagine or predict this material response. The descending, downrange 'tongue' that sprouts from the impact point and dives to nearly 1/4 of the spherical radius has been achieved before, but not the sudden shift in it's curvature polarity from concave downward to upward at the deepest level where fracture sets return abruptly back to the surface of the sphere. These are brittle fractures, probably conchoidal in nature owing to the occurrence in silica glass, but with no apparent material offsets at the level of energy absorbed. There is an excavated crater where the glass was blown from the surface (fig. 10). But the basal geometry of the downrange strain field shows no apparent material offset and departs from the smooth, parabolic base that I previously envisioned and modeled from studying the nature of the Chicxulub and Chesapeake impacts on the North American tectonic plate (NAP).
In summary, strain fields generally range in size from those having been produced by high-angle impacts to those with low ones producing the smallest strain fields. More experimentation is needed to better understand the geometry of fracture and fault systems stemming from impacted media at various incidence angles.