 www.impacttectonics.org
G.C. Herman,
PhD
March 14, 2026
BoreholeSectionPro_v25.exe (50.5 MB) User
Guide
Please email me at
gcherman56@yahoo.com if you're
interested in downloading an executable copy using an MSDOS command shell prompt.
Venmo purchases only.
1.
INTRODUCTION
The Borehole Section Engine
is a specialized structural geology tool designed to
project 3D borehole televiewer (BTV) data onto a 2D cross-section.
This is an executable version of a python script that can help visualize a
site's hydrogeological or structural framework by reading comma-delimited BTV
feature logs and plotting certain primary and secondary geological structures
directly into 1:1 scaled cross section in MS PowerPoint.
It currently runs in
a MS DOS command window and requires user input for
six line prompts including the section azimuth, plot scale, and line lengths
(accents) of primary (bedding or layering/foliation) and secondary (fault,
cleavage, and fracture) structures. Conductive planes when noted are prioritized
in the symbol hierarchy. The program reads data files for all
boreholes in a directory, plots the primary and secondary structures at their
specific positions and apparent dips, generates structural rose diagrams (histograms),
optionally handles borehole
drift using vector displacement logic, and creates a two-slide
PowerPoint presentation.
Tabular input files
Examples of a Wells.csv and an example BTV.csv are shown below.


MS PowerPoint output graphics
The resulting map and cross section with rose diagrams
are shown below.

2. DATA REQUIREMENTS
To use this tool, your data must be organized in a specific folder.
A. The Project Folder
Create a dedicated folder for your
project. This folder must contain:
-
Wells.csv: A master file containing the geographic locations of all borehole
collars.
-
Individual Well Files: Separate CSV files for each borehole containing the
structural readings and drift measurements.
The well-file names
must be the same as those used in the Wells.csv file.
For example, for the Wells.csv shown above, the corresponding BTV file names are TW.csv, OW1.csv,
etc.
B. File Formatting
Wells.csv (Master File)
Required column headers:
-
Well: Borehole ID (e.g., Well1).
-
Longitude: Decimal degrees.
-
Latitude: Decimal degrees.
-
Altitude (m): Elevation of the well collar in meters above sea level.
Individual Well CSVs (The well-file names
must be the same as the well names used in the Wells.csv file)
Required column headers:
-
Alt. (m): Elevation of the specific reading.
-
Dip: True dip angle (0-90°).
-
Azimuth: Dip direction (0-360°).
-
Type: Structural category (Bedding, Layering, Foliation, Fault, Cleavage,
Fracture).
-
Kind: Used specifically to identify "Conductive" planes.
-
Optional Drift Columns:
-
BHAZM: Incremental borehole azimuth (0-360°).
-
BHTILT: Incremental borehole tilt/inclination from vertical (0-90°).
3. HOW TO RUN THE TOOL
-
Launch: Run the compiled BoreholeSectionPro_v25.exe.
-
Select Folder: A Windows folder browser will appear. Select the project
folder containing your Wells.csv.
-
Select Trace Mode:
-
Type 'v' for Vertical: Boreholes are treated as straight vertical lines.
-
Type 'd' for Drifted: The tool calculates the 3D path of the borehole
based on BHAZM and BHTILT data using vector displacement logic (Herman
et al., 2015).
4.
INPUT PARAMETERS
Accept the defaults by pressing Enter, or provide custom multipliers:
-
Azimuth: The viewing direction for the section.
-
Zoom: Overall slide scaling.
-
Accent Multipliers: Controls the visual length of structural symbols for
Conductive, Fracture, Bedding, Fault (1.5pt weight), and Cleavage types.
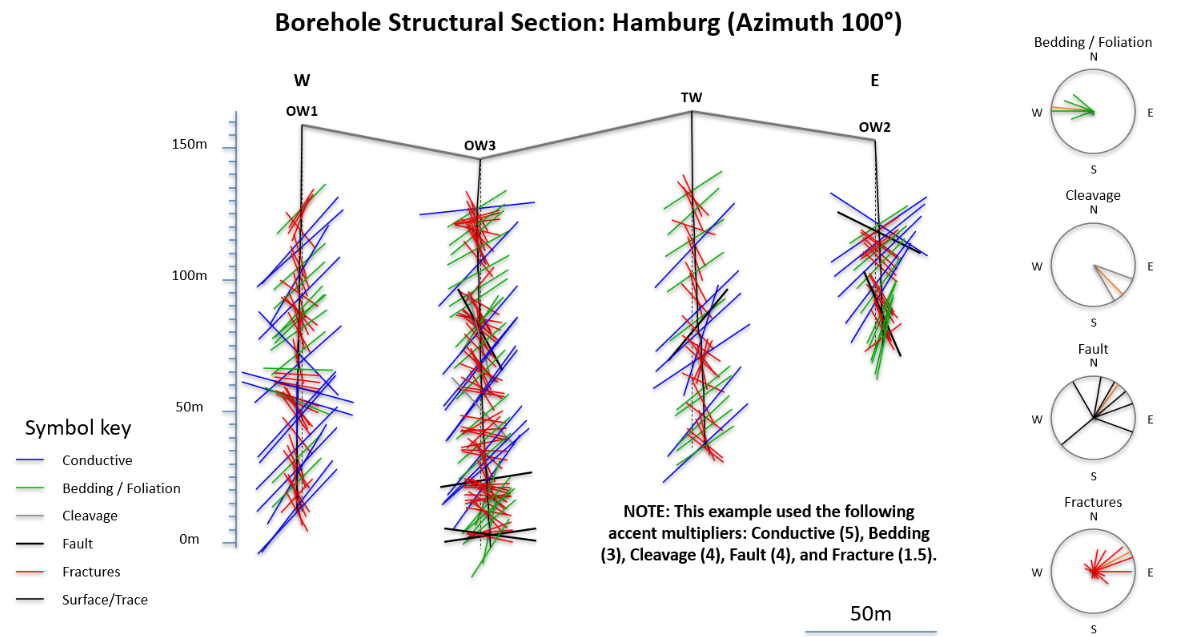
5. INTERPRETING THE OUPUT
The tool produces a two-slide PowerPoint presentation (Pro_Section_[Project]_Az[#].pptx).
Slide
1: Structural Cross-Section
-
Borehole Traces (Black):
-
In Vertical mode, these are solid black lines.
-
In Drifted mode, the actual path is a solid black line, while a dashed
vertical line (0.5 pt) is provided as a spatial reference to emphasize
the drift.
-
Structural Symbols (Color Key):
-
Green: Primary structures (Bedding, Layering, or Foliation).
-
Blue: Conductive planes.
-
Red: Fractures.
-
Black (1.5 pt): Faults.
-
Medium Gray: Cleavage.
-
Histograms: Separate rose diagrams for each type with an Orange vector
representing the statistical mean trend.
-
Scale Bar: A 50m scale bar with a center-justified label.
Slide 2: Well Location Map
-
Black Dots: Represent well collar locations.
-
Black Trace: Shows the orientation of the cross-section relative to the
wells.
6. TECHNICAL NOTES & TROUBLESHOOTING
-
Conductive variables take precedent. So if a plane is marked primarily as
bedding and then conductive, it will be plotted as a conductive plane using
the same symbology as for conductive fractures, faults, etc.
-
Drift Logic: Drift is calculated incrementally from the collar downward. If
BHAZM or BHTILT data is missing for a specific depth, that segment is
treated as vertical.
-
Scale Integrity: The section maintains a 1:1 aspect ratio, ensuring apparent
dips are visually accurate without vertical exaggeration.
-
File Access: Ensure the PowerPoint file is closed before running the tool,
or a "Permission Error" will occur.
7. REFERENCE
Herman, G.C., French, M.A., and Curran, John, 2015 ,
Borehole Geophysical Logs and Geological
Interpretation of Two Deep, Open Boreholes in the Passaic Formation, Elizabeth
City, Union County, New Jersey (9.1
MB PDF): NJ Geological & Water Survey Geological Series Report GSR 42, 26 p., 2
appendixes, 1 zip
file (14.5
MB).