TECTONICS BLOG Rev. 2021-05-25
Gregory Charles Herman, PhD   Flemington, New Jersey, USA

2021 Structural traces and tectonic aspects of 13 Martian astroblemes
Figure 1. Prior work focused on mapping the Syria-Sinai Planums strewn field on Mars using Viking 2 mission high-altitude imagery and Mars Orbital Lander gravity and topographic data2016 Google Mars 1.0

Figure 2. A captured segment of the USGS
Mars Topography showing strain sectors and impact-tectonics of the Syria-Sinai Planums strewn field
Syria-Sinai astobleme ca. 2007

Features and Data Sources * Interpretation Process Discussion * GCH_Google_Mars_2.0_KMZ

Remotely sensed geospatial data are used to conduct a structural and tectonic analysis of the very large impact craters and sedimentary basins seen on Mars. The analysis includes the physical dimensions of large craters, their surrounding crustal and lithospheric strain fields including linear traces of their structural expression on the plant's surface stemming from large, hypervelocity bolide (asteroid and comet) impacts. An orientation analysis of fault and fracture traces seen on Mars surface for 13 different astroblemes demonstrates that brittle crustal failure stemming from hypervelocity impacts adheres to Coulomb shear-failure criteria for material failing under uniaxial compression. Mars is devoid of tectonic-plate plate drift as seen on Earth and therefore, most tectonic features including crustal fractures, faults, and folds stem from extraterrestrial bombardment by asteroids and comets (bolides) striking the planetary surface at oblique incidence angles and sometimes forming large igneous provinces in their wake, or in the case of near-vertical impacts, antipodal igneous provinces. The largest impact events produce deep-seated faults in the planetary lithosphere as revealed from prior magnetic mapping.

Introduction

I focus my impact-tectonic research on Mars again here for a second time in two decades to show how mountains can rise and large basins form in terrestrial crust and lithosphere from instantaneous, catastrophic upheavals caused by large-bolide impacts. The first structural analysis of the red-planet's impact scars (figs. 1 and 2) in 2007-09 was spurred on by the many years of my staring at the US Geological Survey's topographic map of Mars hanging on the wall across the hallway from my cubicle in the geophysics wing of 
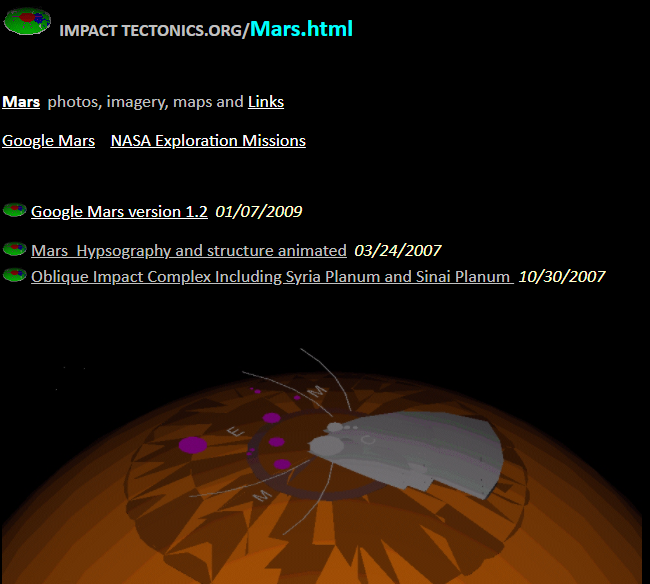
the NJ Geological Survey. That map is dominated by such notable Martian features as Valley Marineris, Olympus Mons and Tharses Montes. Those structures comprise an enormous impact blemish stemming from an asteroid shower with a strewn field centered on Syrian and Sinai Planums (fig. 1). The crustal disruption is extensive and stands out as an enormous red bruise (elevated topography) on the planetary surface with a circumferential welt spanning the distance of any major continent on Earth by comparison (fig. 2).  The definition of this astrobleme was included in Google Mars version 1.2 that was developed using Google Earth (GE) as a base map before Google Mars was released as an integral part of the standard revisions of GE Pro . As recently shown for a set of Cretaceous-age suspected impacts in the western Pacific ocean basin, the impact-generated fracturing, faulting, and folding mapped for a large terrestrial event like this one are the structural components of "astroblemes" or "star wounds" as defined by Dietz (1961), a plate-tectonic patriarch that helped discover sea-floor spreading. In my mind this term just as easily can be thought of as asteroid-impact blemishes (astero-blem).  These planetary-disrupting impact events bruised and welted the planetary surface during episodes of mass accretion from extraterrestrial bombardment. The astroblemes are the telltale signs.

This study defines structural elements associated with 13 of the largest bolide-impact scars and sedimentary basins on Mars (figs. 3 and ). The large sedimentary basins are included as they stem from very large impacts events, with most involving multiple bolide strikes from fragmented or clustered projectiles having a focused concentration within a relatively small region, or strewn field. These basins are now filled with oceanic or aeolian detritus that masks the craters, just like those on Earth recently discovered lying beneath kilometers of sedimentary overburden from subsurface petroleum and water geotechnical investigations, and corroborated with geophysical potential-field and seismic-reflection studies.   These impacts generated tectonic episodes of both sedimentary basin and mountain genesis, and in many cases spurred the development of large-igneous provinces (LIPs). Some impact events punched depressions into the lithosphere while others formed expansive regions of material accretion and structural disruption from having received multiple incident bolides within a strewn field (fig. 4).

Each astrobleme form reflects the many variables of impact energetics, but mainly the size, composition, velocity and trajectory of the bolide, the latter of which is geometrically assessed with respect to it heading, or the horizontal trace of its flight path, and its angle of incidence. No effort is made to estimate the size of the projectiles based on cratering criteria, as that is not the focus here. Those calculations can be partially constrained by the crater diameter and target composition, but my aim is to see how secondary geological structures spatially and geometrically manifest themselves with respect to each large crater or sedimentary basin, particularly with respect to interpreted  impact trajectories and the distribution of planetary, LIPs. Most impact events are oblique rather than normal-incident strikes. The character of those glancing off the planetary surface at low-incident angles (1-30o) transmit less ground energy and fan out over broad regions from splashing down, ricocheting and fanning out downrange of the area with the largest craters.

Google Mars is used as part of the standard GE Pro engine to map and parameterize the most apparent astroblemes as summarized below in figure 3. The analysis is based on topographic and geophysical planetary-scale geophysical themes added to GE that show regions of tectonic disruption stemming from these catastrophic, and geologically 
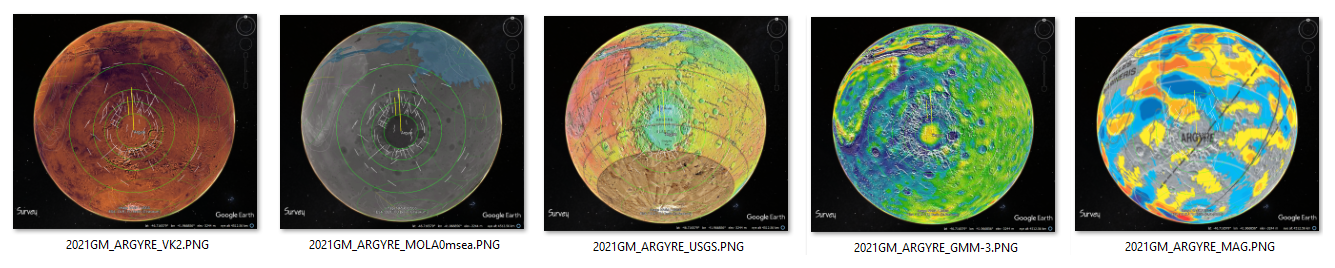
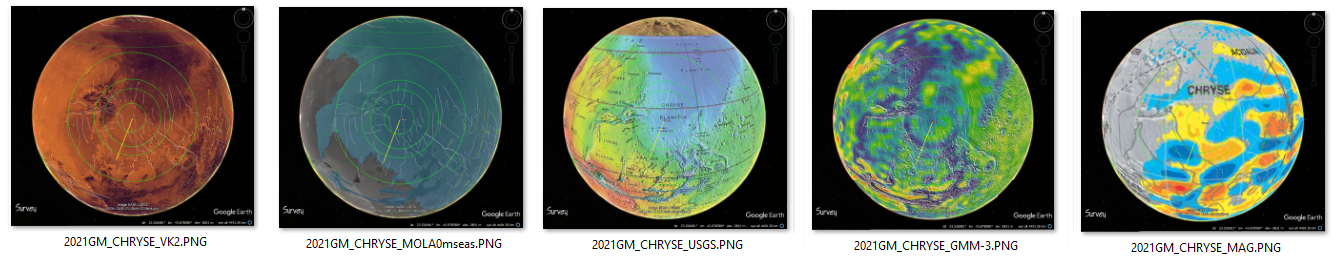
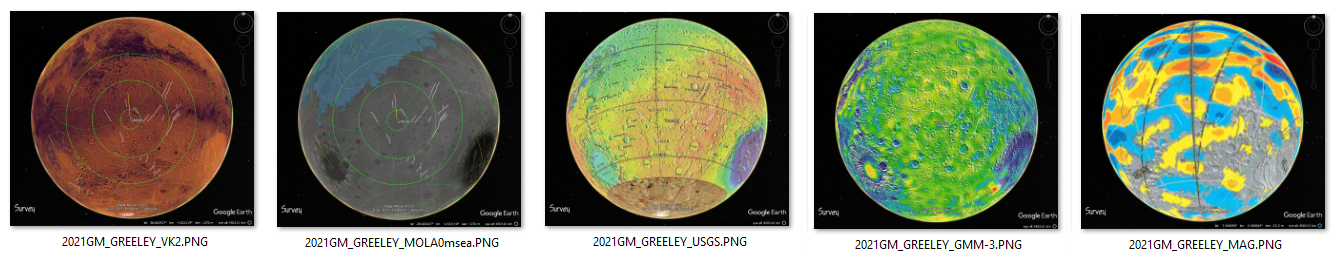
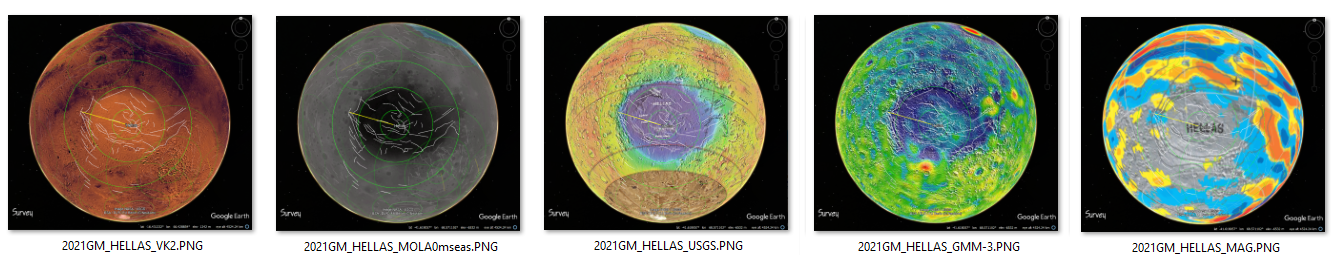
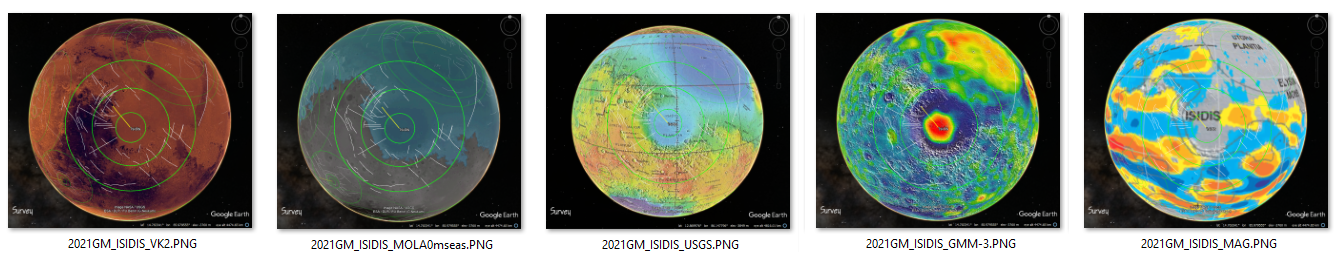
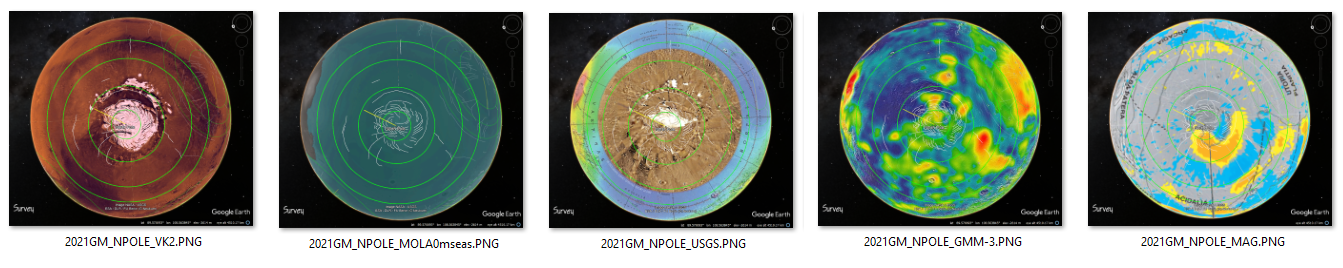
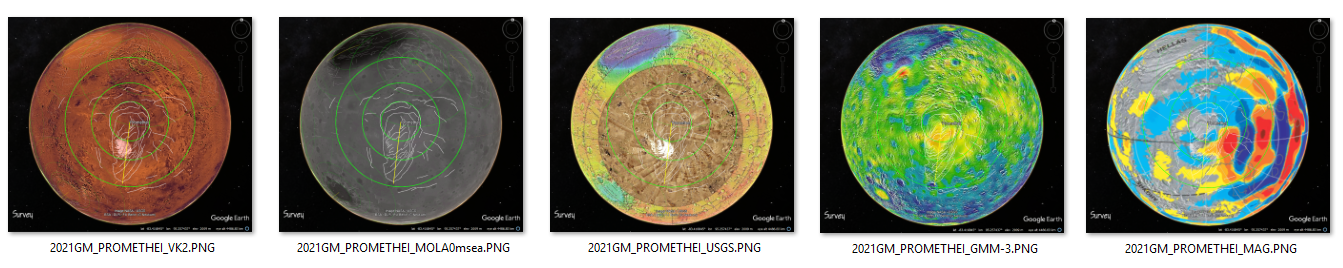
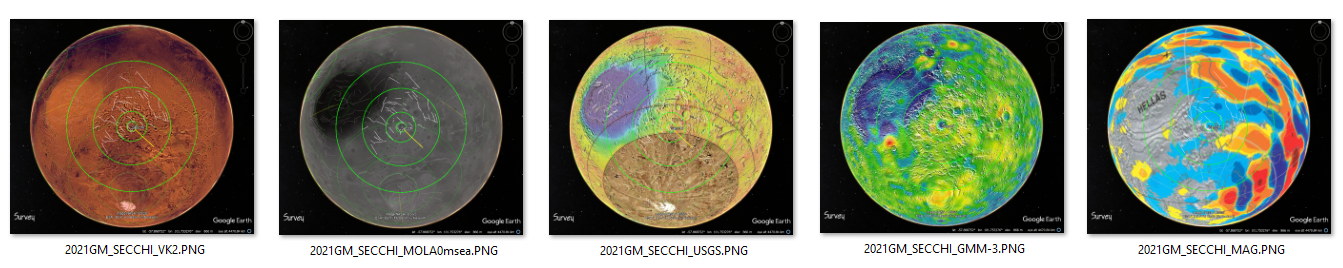
instantaneous, large-impact events.  A set of planetary-scale images were captured for each astrobleme using five different base-image overlays serving as the basis for mapping geological structures interpreted to stem from each impact event. The base imagery include NASA Viking 2 colored photography, United States Geological Survey (USGS) Topography, and global laser altimetry, gravity, and magnetic themes.

The composite set of strain features of each astrobleme are mapped and organized as GE theme elements in folders within a GE KMZ file (fig. 3). The study methodology is detailed below including explanation of the organizational structure of the KMZ file containing the structural elements of this study as geospatial line elements used to visually emphasize each event (fig. 3). These elements specifically include center points for each astrobleme with some coinciding with visible craters while others are approximate centers of large crustal basins with hypothetical, hidden craters masked by thick sedimentary blankets. The digitized polyline traces of linear, curved, and circular features defining each astrobleme are organized in file subfolders (fig. 5).

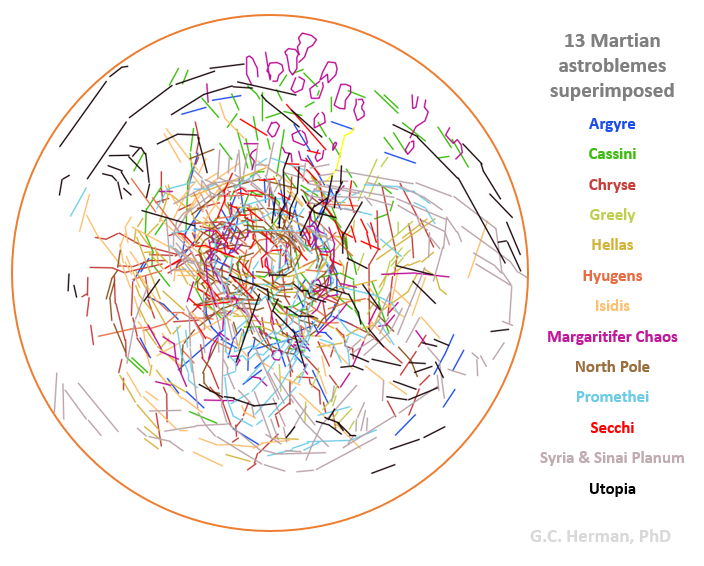
Figure 3. 13 Martian astroblemes superimposed using GQIS

13 Martian astroblemesInterpreted headings and incident angles are estimated for each interpreted event based on the systematic arrangement of the spawned, secondary structures together with the crater morphology where exposed (figs. 6).  For moderate- to low-incident angle strikes, compressed foreland regions located down range systematically fan out in front of craters where the crust and lithosphere were shoved, displaced forward, and structurally compounded and thickened.  A graphical summary of the trajectory statistics compares the headings of these large-impact events based on the structural analyses (fig. 6).

Named features and data sources

The names of the 13 astroblemes are derived from place names seen in Google Mars, or on the the USGS topographic map that lie closest to the crater or basin center point, while others derive their names simply by location as in 'the North Pole' event (fig. 3). Prominent craters are mostly named with some having been targeted as bases for human extraterrestrial exploration. In other places, large impact carters are assumed to lie beneath deep sediment-filled basins or are covered by oceanic sediment from long-ago evaporated seas covering much of its northern hemisphere, or beneath thick blankets of loess deposited during frequent wind storms.

The thirteen named folders contained in the KMZ file hold the interpreted structural features including crater center points and both circular and linear paths distributed around craters that highlight systematic, far-field strains in each astrobleme resulting from impact tectogenesis. Some traces of linear features seen on the surface imagery are not assigned to any particular event here, and are being compiled separately as this is a continuing and evolving effort.  Other structural features representing tectonic elements like like-volcanic edifices, are also interpreted to stem from some impact events, and in those cases are also shown to be arranged with systematic geometry with respect to large impact craters or strewn fields and is likewise discussed in more detail later.

Because the nature of the impact target factors into the impact-tectonic effects, it is important to discriminate between continental and oceanic realms in study the physical effects of impacts. Because there is no freely available oceanic theme currently available for Google Mars, I built one using NASA's Mars Orbital Lander Altimetry (MOLA) theme. The oceanic theme uses the MOLA digital-elevation model from NASA he Mars Ocean at 0 and -30 m elevation using the Mars Orbital Laser altimetry that was downloaded and processed using a geographic information systems. The global digital-elevation-model (DEM) is available from the NASA data Annex. It's a gray scale raster image derived from the Mars Global Surveyor (1996-2001) mission.  I used QGIS (ver. 3.102) to process this DEM into a gray-shaded base-map image having darkened, low elevations and lighted higher ones (fig. 3). Polygons encompassing topography less than the 0 and -3 km elevation values over the northern hemisphere were generated and colored as blue with their opacities set to 10% (90% transparent).  This processed first involved generating 1-km hypsography from the DEM, then selecting the 0 and -3 km contours and manually closing them into polygons by adding line segment along the image perimeter.

Figure 4. Structural and geophysical aspects of 13 Martian Astroblemes.
Use the string <www.impacttectonics.org/2021/> and type the image name onto the end for detailed imagery.

1. ARGYRE - North heading (~355o) with a high incidence angle (>60o).

Argyre atrobleme

2. CASSINI - Multiple, oblique impacts, north heading (~350o), moderate incidence (> 30o and < 60o).

Cissini astrobleme

3. CHRYSE - Multiple (?) impacts, north heading (~000o), moderate incidence (> 30o and < 60o).

Chryse astrobleme

4. GREELY - North heading (~000o), moderate incidence.

Greely astrobleme

5. HELLAS - West heading (~280o), high incidence.

Hellas astrobleme

6. HYUGENS - West heading (~265o), moderate incidence.

Hyguens astrobleme

7. ISIDIS - Northwest heading (~300o), high incidence.

Isidis astrobleme

8. MARGARITFIR CHAOS - Northeast heading (~020o), low to moderate incidence.

Margaritifer Chaos

9. NORTH POLE - Northwest heading (~315o), high incidence.

North Pole astrobleme

10. PROMETHEI - North heading (~010o) with low incidence. (This perspective shows the South Pole.)

Promethei impact

11. SECCHI - Southeast heading (~130o) with high incidence

Secchi astrobleme

12. SYRIA AND SINAI PLANUMS - Multiple impacts, southeast heading (~140o), moderate incidence

Syria and Sinai Planums

13. UTOPIA - Northwest heading, high incidence.

Utopia astrobleme

This section summarizes the sources of the added base imagery, and how the work was conducted using the imagery together with the GE RangeRings application to conduct each analysis. As mentioned earlier, the US Geological Survey Topographic Map of Mars was used in a prior spatial analysis based on compiled NASA Viking 1 and 2 mission (1975-1982) global imagery included in the Google Mars 1.2.KMZ file. This raster imagery is a photographic mosaic of Mars surface that provides a detailed, uniform-colored mosaic to aid in the visual scrutiny of very-large crustal-impact features. This imagery is not included with the 2021_Google_Mars_2.0.kmz file. The file contents of  2021_Google_Mars_2.0.kmz are summarized below as a screen capture from the GE Places pane. It includes 5 raster themes and 18 vector ones.

Figure 5. The 2021_Google_Mars_2.0.kmz file contents

Google Mars 2.0 KMZThe Mars gravity theme is referred to as the GMM-3 Mars Gravity Map, a NASA global map of the gravity field of Mars referred to as the Goddard Mars Model (GMM) 3. It was created by studying the flight paths of three Mars-orbiting spacecraft — Mars Global Surveyor (MGS; 1996 - 2006), Mars Odyssey (ODY; 2001 - ), and Mars Reconnaissance Orbiter (MRO; 2005). This themes was simply added to GE as a georeferenced image overlay. Similarly, the Mars magnetics theme is also a georeferenced image downloaded from Wikipedia under the title 'crustal magnetism'. It is a 1013 x 505 pixel PNG image that was generated from flights of the MGS as published by Connerney and others (2005).

The <2021 MOLA Ocean 0 m> theme and base map was generated for this study using the NASA MGS digital elevation model (DEM) for Mars with a horizontal resolution of 463 m per pixel and elevation accuracy of + 3 meters. The Mars Orbiter Laser Altimeter, or MOLA, is an instrument on the MGS that was used to successfully map Martian surface features over a 4-1/2 year period ending in 2001. The DEM was downloaded as a georeferenced raster image (TIF file) and processed in QGIS Desktop version 3.10.2 to generate a theme representing the former, oceanic realm. QGIS was used to first generate topographic contour lines from the DEM. The resulting 0-m hypsographic polyline was selected, then edited to form a closed polygon covering much of the northern hemisphere lying below 0-m elevation. This elevation coincides very well with surface features showing characteristics of shoreline erosion, but it is uncertain as to what maximum elevation the Martian seas rose, and how long it took them to evaporate. The other aspect of this theme is that only one polygon covering much of the northern hemisphere was generated, and therefore, large sedimentary basins lying below 0-m elevation in the southern hemisphere that may also have held active seas are not represented here.

The interpretation process

The structural interpretation of impact-tectonic strain fields is complicated and with many uncertainties and comprised by the inevitable misidentification and prejudice. Nevertheless, the exercise was completed after progressing through three interpretation passes, with the second and third refining the heading of some impacts based on the initial pass and the subsequent statistical analysis of line traces for each astrobleme (fig. 5). The latter two passes also assessed how the far-field strain fields appear to overlap and interfere with one another. Tectonic inheritance is seen where strain fields merge and overlap because the crust and lithosphere becomes strain hardened from the hypervelocity shock of impact and the consequent formation of healed, brittle structures in the lithosphere to suspected depths of about 600 km (fig. 6). Impact- and drift-related tectonic strains for ensuing tectonic events will propagate through previously shocked lithosphere differently than for less-shocked regions. I suppose this is good time as any to remind the reader that their are no 'un-shocked' or pristine regions on terrestrial planets or Moons, other than newly formed oceanic crust on planets having recycling tectonic plates like Earth, but for Mars the entire planet is formed from bombardment and accretion, even during initial cooling and condensation from a planetary embryo. Additional consideration was given to examine the strain fields with respect to the possibility that some of the large impacts occurred in areas covered by shallow seas on Mars northern hemisphere earlier in its history before they evaporated.

Once the custom imagery was compiled as a basis for visual scrutiny of astrobleme structural signatures, the first step in the interpretation process involved generating circumferential rings around each visible crater, or sets of crater in a strewn field, or approximated centers of large sedimentary basins that are assumed to stem from a very-large bolide-impact event. Circles around each crater were generated using the GE custom application RangeRings available from EarthSurvey.us.  The tool works by setting the center point and entering a specific radius, using kilometers for this project. Outboard circles of 600, 1600, and 2900 kilometer radii were thus generated around most craters or basin centers that represent circumferential, arched welts lying thousands of kilometers outboard of the craters with amplitudes of 1-3 km.  The circles represent the approximated traces of circumferential crustal arches that mark the edge of large sedimentary basins or fractured areas of high topographic relief lying outboard of the craters. These radial components represent far-field welts of low amplitude resulting from epeirogenic movements eons after the impact event from lithospheric flexure and ensuing asthenosphere responses. The timing and nature of such brittle-ductile processes remain hypothetical and await future modeling, testing and refinement. But from empirical measurements, they are remarkably similar in size to those seen on Earth. The tectonic manifestation of these features is elaborated further below.

Once each crater was delineated as a multi-ring impact structure, the next step was to manual digitize apparent surface features and remotely sensed geophysical anomalies that occurred in close proximity to the crater(s) that demonstrate symmetric arrangement about the crater in a plausible manner, as for example, by having faulting geometry reflecting Coulomb shear-failure criteria with conjugate sets striking within 30o of the bolide heading (fig. 6). In some cases, pronounced sets of emergent, crustal faults stem from craters and radiate outwards, whereas in other places, secondary structures coincide with surface scarps or rims of crustal depressions, or arches lying circumferential to the crater but thousands of kilometers away (figs. 4 and 6). Structural traces of astrobleme elements were thus digitized manually using the five geospatial, planetary themes providing the visual contrast of color intensities and hues reflecting physiographic relief seen on the planetary surface or the more deep-seated, lithospheric structural elements interpreted based on potential-field gravity and magnetic anomalies. The various structural elements are represented using GE paths (vector polylines) having vertices at inflection points between connected and continuous line segments.

Figure 6. Structural analysis of 13 large, Martian astroblemes on a gray (continental) and blue (oceanic) base.

Argyre Cassini-Tikhonravov Chryse  
Hellas Hyugens Hyugens  
Isidis Margaritifer Chaos North Pole  
Prmethei Secchi Syria and Sinai Planums  
  Uropia    

The process of capturing the five images for each event involved first setting the eye altitude in GE to between 4 to 5 km with the planetary astrobleme centered in the viewing pane. Other astroblemes lying peripherally to the focus area were adjusted to about 50% opacity to highlight the features of concern before capturing its structural expression on each base image using the Microsoft application Snip. Upon generating the 5 respective images for each event, the Microsoft (MS) Windows file explorer was used to next capture extra-large thumbnails of each of the 5five images that were then composited together using MS Paint for each event, saved, and displayed sequentially in figure 3.

Circular histogram analysis of astrobleme structures

Each of the 13 astroblemes is unique regarding both size and geometry.  The QGIS geographic information system software was used to statistically analyze each one's structural signature relative to their interpreted trajectories. The trajectory is separated into into right-angle components lying in an imaginary vertical plane including the horizontal heading relative to North and with incident angles that can vary from 0o to 90o, with the former lying parallel to the ground surface (horizontal) and 90o being normally incident. Since most impacts fall between the two extremes, most are oblique events that are grouped here into gentle (1o-29o), moderate (30o-59o), and high, or steep (60o-89o) incident angles because it is impossible to determine exact ones. Those of normal to high-angle incidence transmit the most ground energy that likely varies as a function of incidence in a trigonometric manner, or:

EQUATION 1.  Ground Energy (BGE) = bolide kinetic energy; BKE * sin (incidence angle(BIA)) * seismic efficiency

Large, high-incident impacts absorb the most ground energy and commonly display uniformly radial strain fields with pronounced lithospheric welts or rings surrounding the main crater area .  Given the same impact criteria for different events, the lesser the angle of incidence, the less ground energy absorbed. Some of the best examples of high-incident impacts are the Hellas and Utopia basins and the North Pole event (figs. 3 and 6). The high-angle events sometimes show  antipodal flaring and magmatism in the form of large-igneous provinces (LIPS). On Mars, truly antipodal LIPS, or those occurring in exact polar-opposite alignment to a large crater appear to occur only from very large, near-normal-incident impacts.  To assess this aspect of their respective occurrences for each event, Trimble's SketchUp software was used to build a Mars-size sphere with a vertical axis running through it and emerging as hemisphere poles (fig. 7). This object can be imported in to GE as a Collada object (file extension *.dae) and spatially manipulated to be variably positioned with one axis end positioned in the center of a crater to provide a visual toolkit for assessing antipodal relationships (fig. 10).that is discussed and illustrated below.

Figure 10. Examples of two-high-angle impacts with antipodal flares, with the Hellas one having antipodal LIP

Two antipodal examplesImpacts of moderate to low incident angles have more variable morphologies displaying skewed strain fields that commonly include compressed foreland sectors lying downrange, or extended hinterland sectors lying up range (fig. 1). As seen in the graphical analysis, most secondary, impact-generated crustal and lithospheric features lie within a 60osector that is bisected by the interpreted bolide headings. This structural behavior is described by Coulomb shear-fracture criteria where brittle failure of compressed rocky media will develop planes of shear failure lying at about 300oangle to the principal axis of compression. Linear surface traces of secondary crustal structures radiate outward in all directions for near-normal impacts whereas those of lesser incidence display Coulomb-fracture envelopes having secondary structures varying in their distribution and strike among the various sectors comprising a circumferential blast pattern (fig. 1)..

Large, oblique impacts of moderate incidence result in foreland wedging and other oblique impacts of moderate incidence result in foreland wedging and hinterland extension. Two of the best examples of large-impact events of moderate incidence are the Chryse and Syria-Sinai Planums strewn fields (figs. 3 and 6).  The resulting emergent, fault and fracture patterns for each event display Coulomb shear-failure criteria and have asymmetric strain fields composed of compressed, translated and compounded downrange crustal sectors, and their complimentary hinterland sectors lying in the craters' wakes where large-igneous provinces (LIPs) develop in extended lithosphere. The timing of these events is poorly constrained at this time, but probably have instantaneous geneses.

Low-angle impacts result in less lithospheric disruption and  spawn secondary strewn fields with numerous, smaller impact craters fanning out downrange, either from ricocheted or spalled fragments from the parent bolide when the tops are sheared off at impact and splash downrange further from the main craters. Such effects are seen for Margaritifer Chaos (fig. 3). The focused, comparatively narrow downrange disruption seen in the Promethean event is interpreted to reflect a low-incident angle. The elongate, ellipse-shaped strain field in the compressed and compounded foreland is also seen for a low-incident impact on Earth in the western Rocky Mountains around Nevada.

Figure 7. A circular-histogram trend analysis of 13 astroblemes comparing the event heading with strain traces.

Structral analysis of 13 Martian astroblemes Discussion

The most apparent structural aspect of these astoblemes is that they together shape the planetary surface. They interfere and overlap and have very pronounced gravity and magnetic effects. The physical dimensions of the far-field, circumferential welts associated with these large-impact events are very similar to those seen on Earth. This has forced me to rethink my initial hypothesis as to their origin and how grounded seismic energy from the impact is transmitted and dissipated in the lithosphere (upper mantle).The most apparent structural aspect of these astoblemes is that they together shape the planetary surface. They interfere and overlap and have very pronounced gravity and magnetic effects. The physical dimensions of the far-field, circumferential welts associated with these large-impact events are very similar to those seen on Earth. This has forced me to rethink my initial hypothesis as to their origin and how grounded seismic energy from the impact is transmitted and dissipated in the lithosphere (upper mantle).

Both radial arching and volcanic complexes occur at about 2900 km distance from large craters as seen for the Argyre, Chryse, and Syria-Sinai Planums astroblemes, among others. This same circumferential, lithospheric arching also occurs around large impact craters on Earth, and therefore, this prominent lithospheric arch probably results more from refracted impact energy impact rather than reflected ground energy, because the diameters of the planets significantly vary, but their lithospheric depths are generally the same from the combined effects of gravity and the geological layering of material involving mineral-phase changes.  Mars diameter is about two-thirds that of Earth and yet the radial lithospheric welting is nearly the same (fig. 9). This points to the probability that grounded seismic energy from impact behaves similarly on both terrestrial bodies, and that the ground energy refracts back to the surface remotely following p-wave paths which flatten out at about 600 to 660 km depth on the respective planets with remote bursts of ground energy involving shear-failure and geological faulting. The strain processes that dissipate ground-energy fluxes in this manner are enigmatic, because no studies that I am aware of deal with catastrophically induced Coulomb shear failure at lithospheric scales that likely follow p-wave refraction paths, but it is one plausible possibility. An important aspect to consider is that seismic body-wave speeds in the lithosphere fall in the range of 3-6 km/sec, whereas instantaneous, catastrophic shearing of the lithosphere should equate to the velocity of impact that occurs at tens-of-kilometers per second, or at least an order or magnitude higher than the host can effectively transmit shock waves. Therefore, the shearing of terrestrial lithosphere by oblique, extraterrestrial indention remains an unproven and largely untested hypothesis, but is portrayed below to follow hypothetical p-wave seismic-refraction paths until proven otherwise. An earlier explanation of these far-field welts focused on reflected seismic energy because of the coincidental dimensions of the radial welting with the boundary depth to Earth's upper and lower mantle (~2900 km). However, the precise mechanism behind observed far-field tectonic strains and whether they primarily stem from refracted versus reflected seismic energy returning to the planetary surface as tectonic structures, or perhaps from other physical responses arising from impact indentation and excavation still await further modeling and verification.  Nevertheless, the nearly identical dimension's of the far-field radial welting seen on both Earth and Mars seems to narrow the focus of the investigations with geometry into the realm of seismic-body-wave refraction paths at this time.

Figure 8. Circular histogram plot of interpreted bolide headings

Projectile-heading analysisMars and Earth comparison

Figures 9 and 10 show that Mars is about 53% the size of Earth, and coincidently about the same diameter as Earth' outer core (fig. 9). This figure also shows the compositional layers for the respective planets. These figures also depict shock envelopes encompassing a 2900-km radius sector around a hypothetical impact point having the geometry of a p-wave seismic disturbance. The shock envelope follows p-wave refection paths as seen on Earth and scaled down for Mars.  Although Mars gravitational field averages about 38% of Earth's, it assumed that the compositional layering of the respective planetary mantles is similar insofar that refracted p-waves flatten out in the 600- to 660-km depth range before returning energy back to the planetary surface within a surface span of about 50o from the impact point in comparison to about half of that for Earth (~27o). The thickness of the lithosphere on terrestrial planets like Earth and Mars may therefore be set by the penetrative depth at which seismic body waves flatten and return to the surface, thereby defining a strain-hardened exterior planetary shell largely created by continuous, percussive impact events. This represents a different way to think about our planet's tectonics, and helps explain why rising mantle plumes tend to pond at the lithosphere base.

Mars lacks robust internal geodynamics, spreading and subducting tectonic plates at its surface, or a strong planetary, electromagnetic field. Its remnant, crustal-magnetic signature is striped in an odd way compared to what we see on Earth with course, alternating bands of contrasting magnetic intensity that resembles planetary-scale gneissic banding (fig.3). The timing and development of the magnetic striping is poorly understand, but Connerney (2005) reports that the field may have originated in a manner similar to Earth's, earlier in it's tectonic history. His mapping also shows that the planetary magnetic field gets perturbed near large craters from grounded heat fluxes and tectonic movements that spur large-igneous provinces (LIPS), thereby giving rise to new geophysical near-surface anomalies that overprint older ones, particularly in hinterland strain sectors of oblique events with decompressive melting like that seen for the Syria-Sinai Planums strewn field (figs. 1 and 3). Mars planetary-scale magnetic banding hypothetically might stem from regional crustal melting caused by very large impact events which catalyze planetary-scale dynamo-thermal metamorphism, allowing silica and iron to segregate into the banded, light- and dark layers when gneiss forms. This banding is absent or disturbed near large astroblemes that have fanned-shaped regions of magnetic crustal disruption like that seen downrange of a large, oblique impact strewn field in the Late Cretaceous seas of the juvenile Pacific Ocean basin on Earth.

Figure 9. Mars 3D SketchUp model showing Earth's seismic-wave behavior scaled down to Mars.

Mars seismic profile

Could it be that during early consolidation phases from the planetary embryo, or perhaps in the aftermath of a very large collision that melts vast regions and perhaps spalls a satellite moon, the planet reconsolidates with mineral segregation by having the opportunity to do so? Iron (Fe+3) and silica (Si+4) naturally segregate into dark- and light-colored layers if given the chance and favorable rheological environment; could this be the origin of banded ironstone formation on Earth? That is, primitive, planetary-scale gneissic banding that's get's perpetually overprinted and locally modified over time?

 Figure 10. 3D SketchUp model showing profile comparison of Mars and Earth with layering, select seismic p-wave traces, and shock structures.

Mars and Earth 

Lacking a robust, organized geodynamo as Earth, Mars apparently develops regional magnetism from catastrophic tectogenesis. That is, most LIPS on Mars occur in the wake of large impacts as part of the astrobleme construct. The best example of this phenomenon is seen in the wake of the Syria-Sinai Planums impact event that spawned both Tharsis Montes and Olympus Mons. And coincidently, two of Connerney's (2005) mapped, large-scale, hemisphere-spanning planetary fault systems are normally aligned with this event's trajectories (fig. 11). The other two planet-spanning fault systems stem from perhaps the most energetic event of them all and represented by the Utopia astrobleme (figs 3 and 11). It also has a vast LIP lying in its wake (Elysium Mons), and two, very large, hemisphere-spanning faults that do not show on surface imagery, but offset the magnetic banding as 'blind' fault systems.

Figure 11. Captured imagery of Google Mars showing four, big, deep-seated faults of Connerney (2005) with respect to the Syria and Sinai Planums and Utopia astroblemes.

Four big faults

Apparently, this event was nearly a "planet killer", and one can only guess as to what may have happened of those faults ended up spanning the entire planet. But seeing that LIPS most commonly occur in the wake of large, oblique impacts, and sometimes in true antipodal alignment for the very big ones, it's again time now to return to Earth and employ this knowledge to help decipher similar tectonic trends here. The end.