 TECTONICS BLOG
Rev. 2022-05-19
TECTONICS BLOG
Rev. 2022-05-19
Gregory Charles Herman,
PhD
Flemington, New Jersey, USA
|
Click on an
image to enlarge it
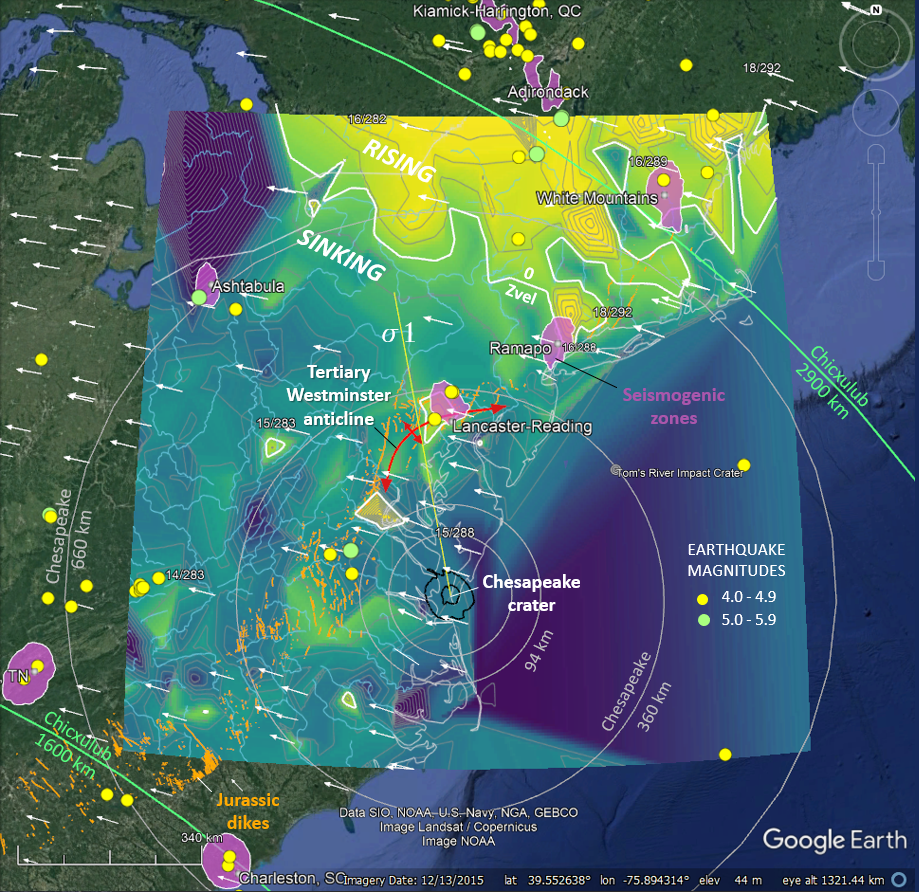
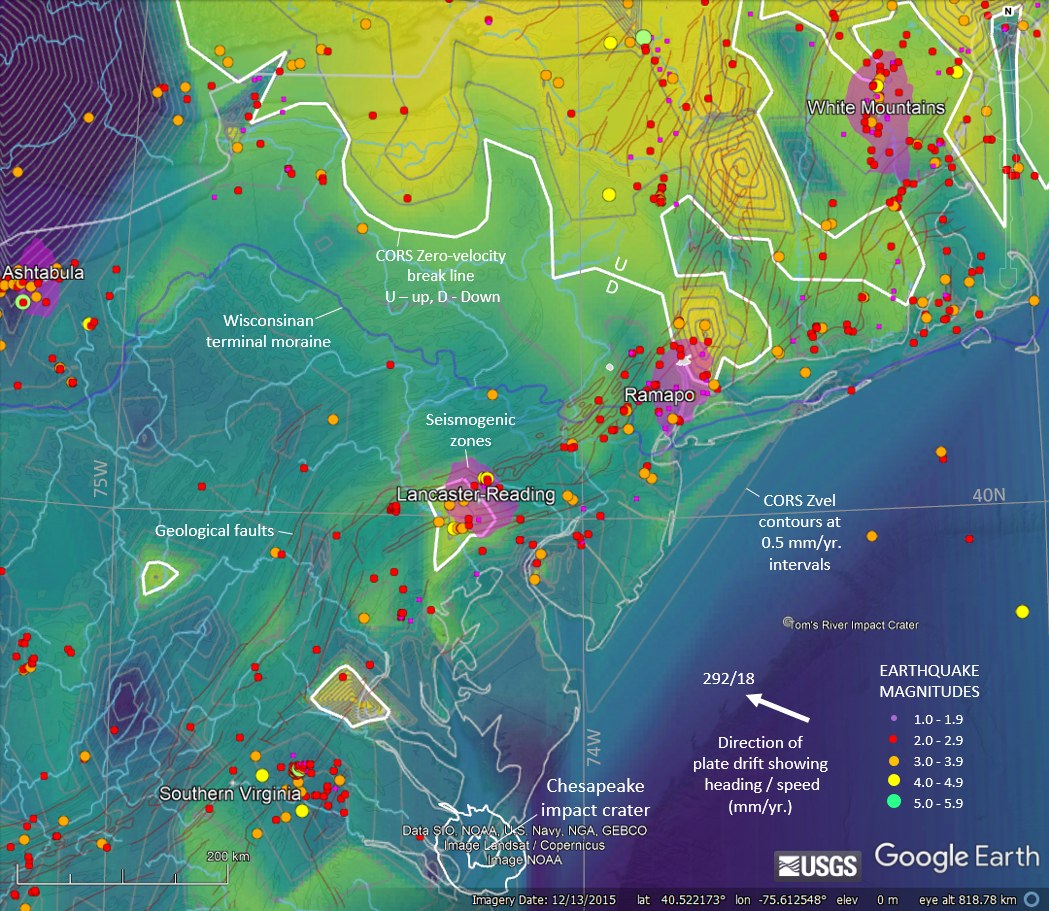
Figure 1.
Overview
of the study area on the mid-Atlantic margin of the North American
continent and tectonic plate showing historical earthquake epicenters in the
region greater than magnitude 4.0, crustal seismogenic zones (Herman,
2006), a CORS
vertical-velocity (Zvel) derivative map detailed below, and scaled white vectors
summarizing horizontal, plate drift. Select drift values are shown using
velocity (mm/yr.) and azimuth format (ex. 14/283). Yellow regions are
rising and blue regions sinking at rates of a few mm/yr. The zero,
vertical-velocity break lines are traced in bold white. The straight, yellow line
trending toward azimuth 350o from the Chesapeake impact
crater denotes the primary stress axis of crustal compression arising
from the mid-Tertiary bolide impact, interpreted as an oblique strike
from the SSE. Circumferential rings are included for both the Chesapeake
(~35Ma- white) and Chicxulub (~66Ma light green) impact craters.
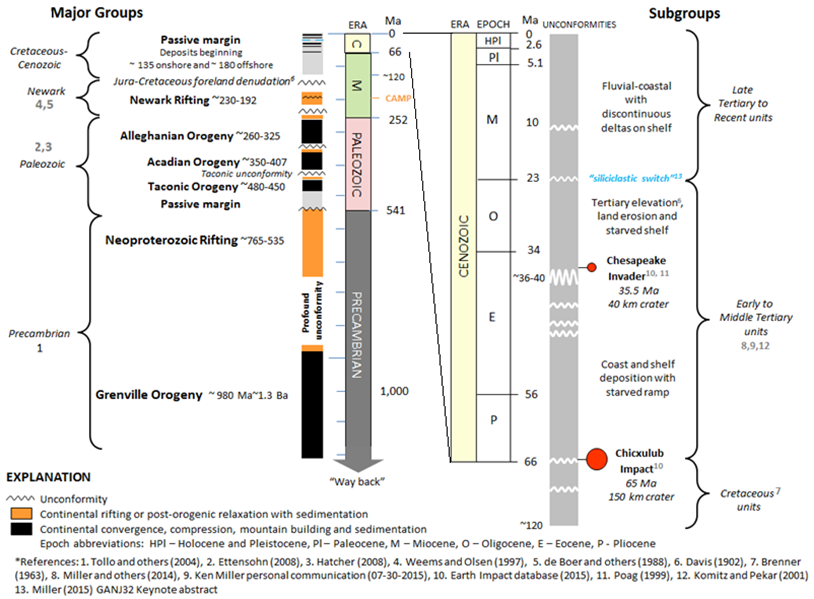
Figure 2.
Chronostratigraphic groups of the NAP mid-Atlantic region used
in a recent neotectonic study of the area (Herman, 2015). References and abbreviations
used for the tectonic and stratigraphic aspects are footnoted. Era and
stage boundary ages from
www.stratigraphy.org.
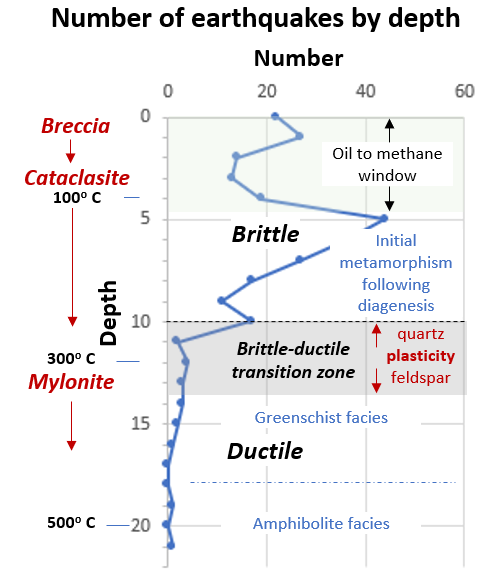
Figure
3.
The hydrocarbon window, crustal metamorphic faces, and tectonite classifications with respect
to the number of earthquakes by depth in the Sykes and others, 2006
earthquake catalog for the metropolitan Philadelphia to New York City
region.
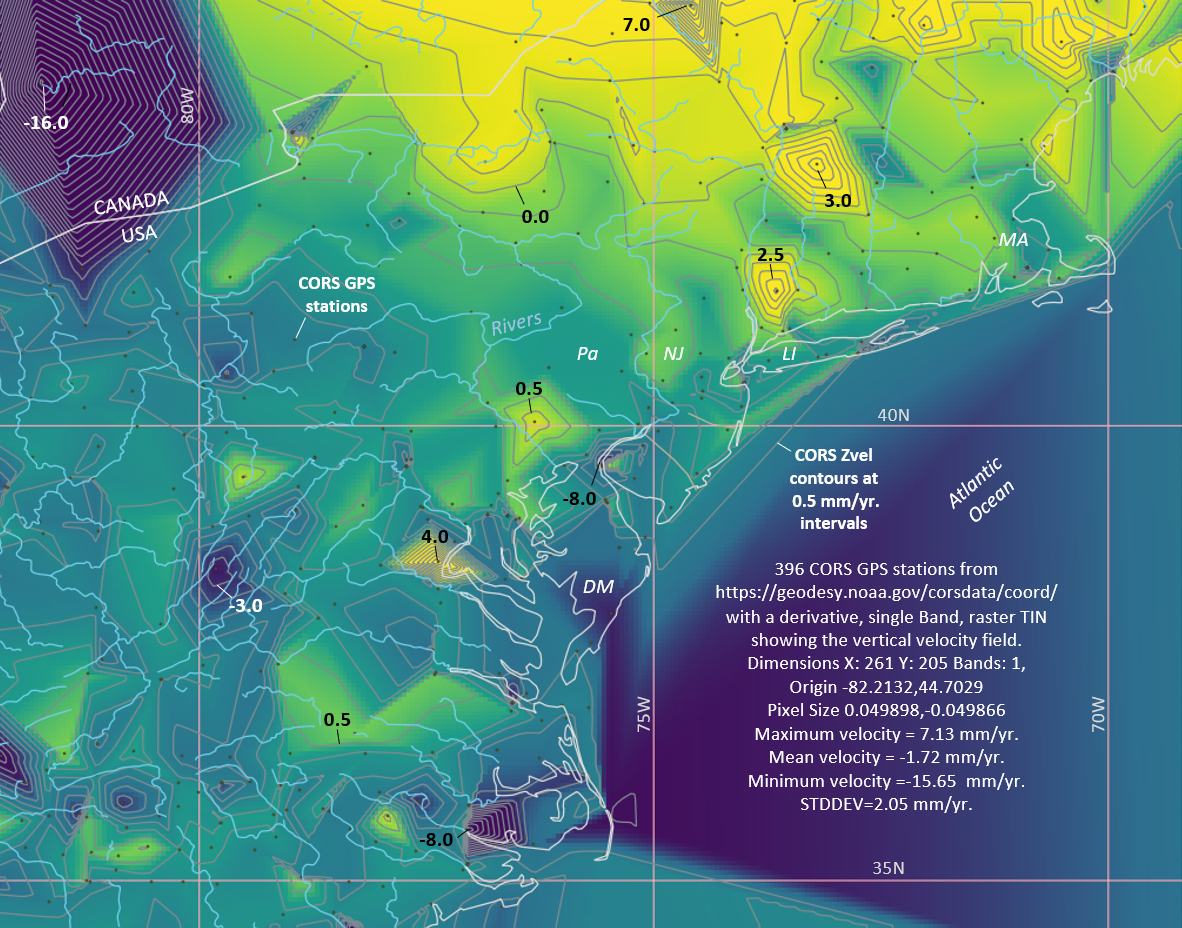
Figure
4. A screen capture from a QGIS project display of the
vertical-velocity-derivative map (Zvel raster theme) showing the 296
CORS GPS station locations with theme parameters noted and spot
velocities labeled.
Figure
5.
The CORS Zvel derivative theme with interpreted seismic zones
(Herman, 2005), NEIC
earthquake epicenters colored by magnitude ranges (Herman, 2015), and US Geological
Survey faults and terminal moraine.
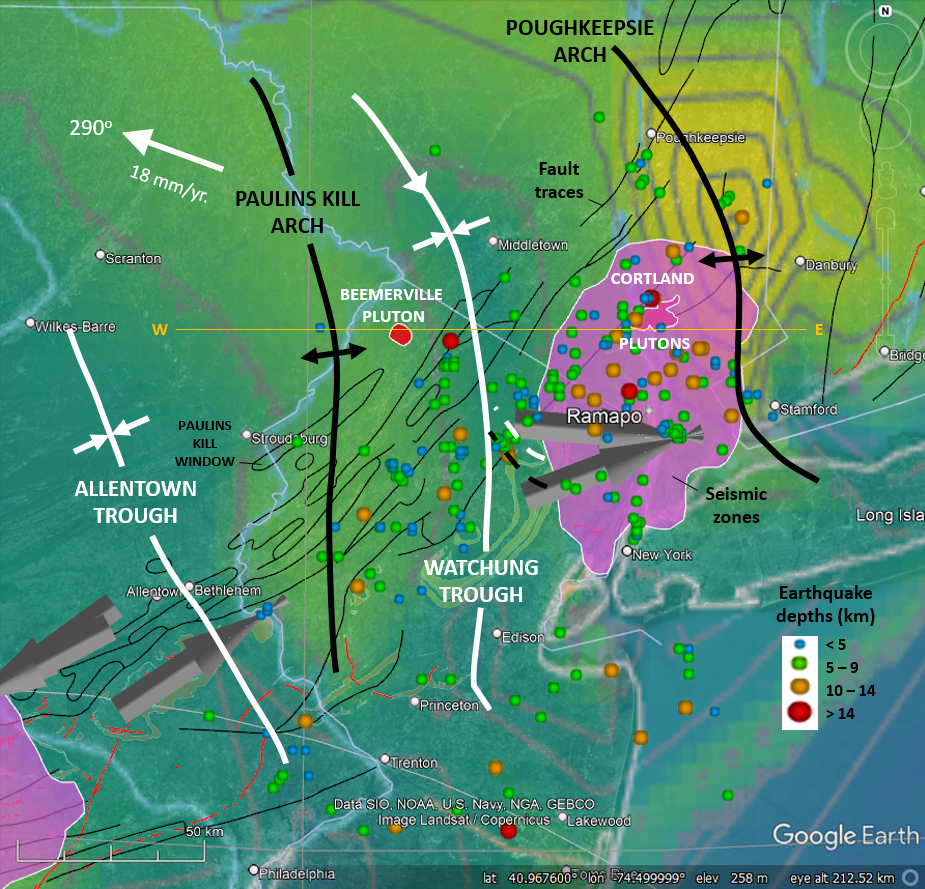
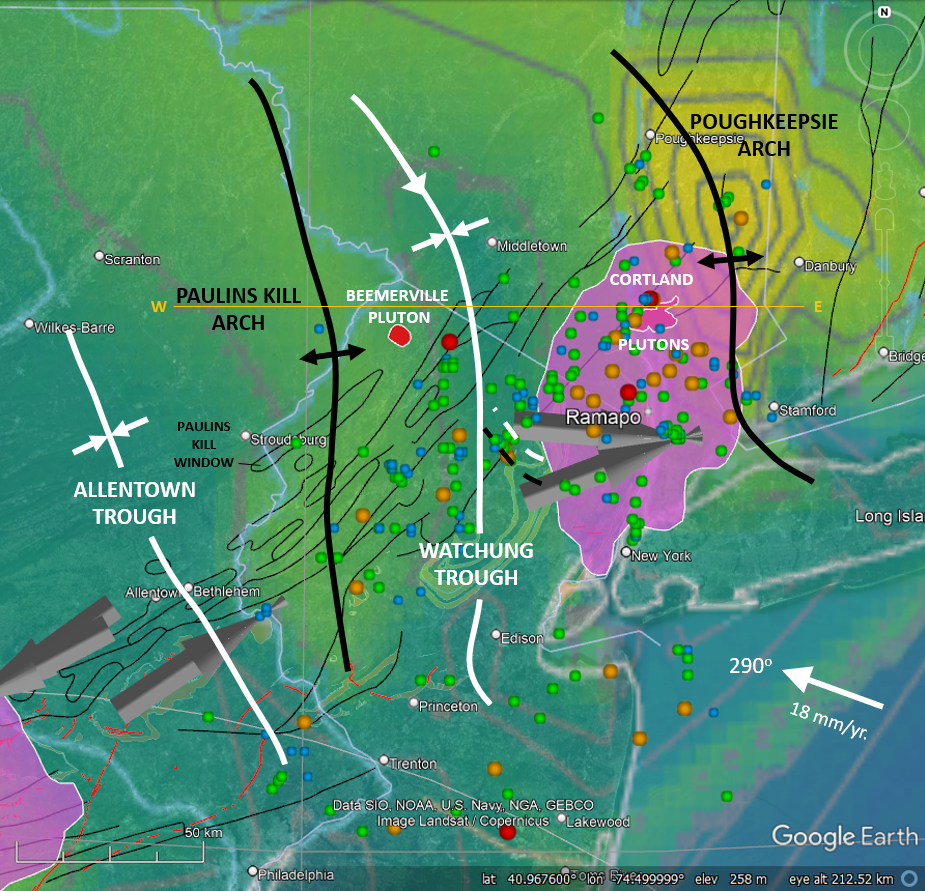
Figure 6. GE display of the Ramapo seismic zone
displaying the Sykes and others (2006) earthquake catalog for the
Philadelphia-New York, NY region and the Zvel derivative base map
summarizing vertical crustal movements. Earthquake-derived compression
(P) axes shown as thick, gray arrows. The region is faulted and wrinkled
along the N-S direction in the vicinity of the Ordovician igneous
plutons rooted in the Hudson Highlands (Cortland) and New Jersey Ridge
and Valley thrust system (Beemerville).
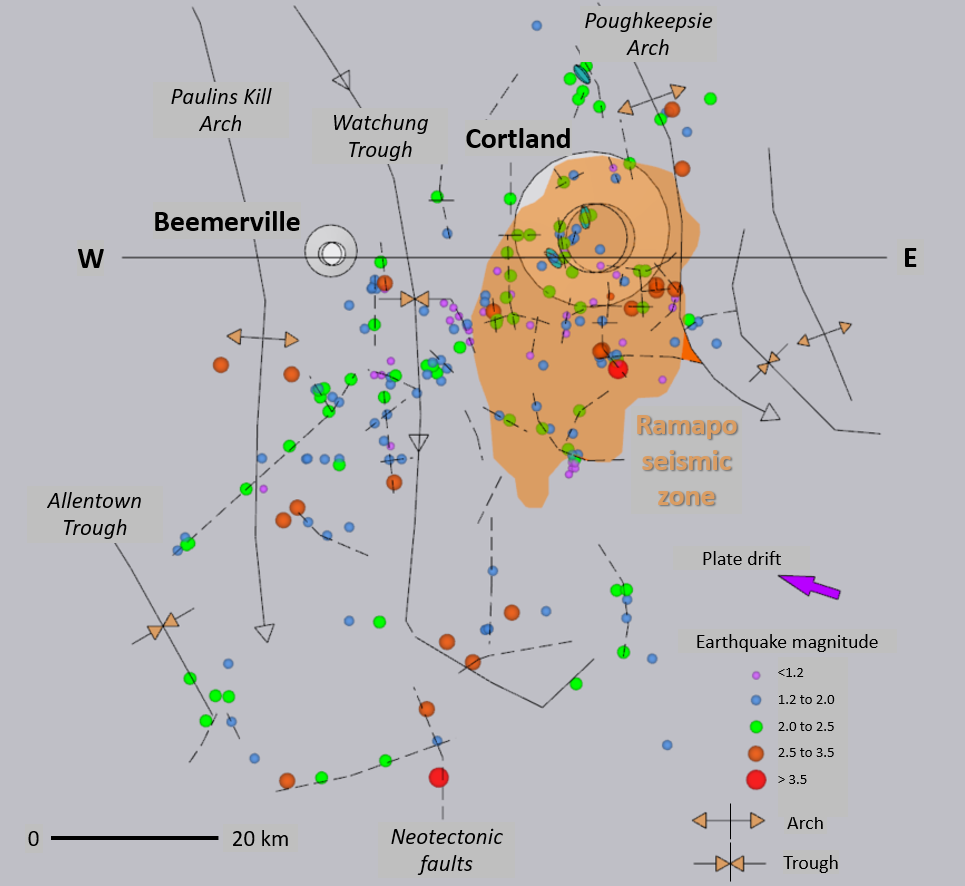
Figure 7.
Top view of a SketchUp Pro (SUP; rev. 2020) 3D CAD model
of seismicity in the New York Recess based on Sykes and others (2006)
earthquake catalog and 243 historical earthquakes by depth and
magnitude. The Ramapo
seismic zone is cored by Ordovician plutons cropping out near Cortland, NY .
Nodal-plane solutions for three, NY earthquakes are included. The model
shows how the crust is locally pinned to the mantle by the plutons,
which focuses crustal seismicity. Neotectonic movements in many places utilize
inherited tectonic structures.
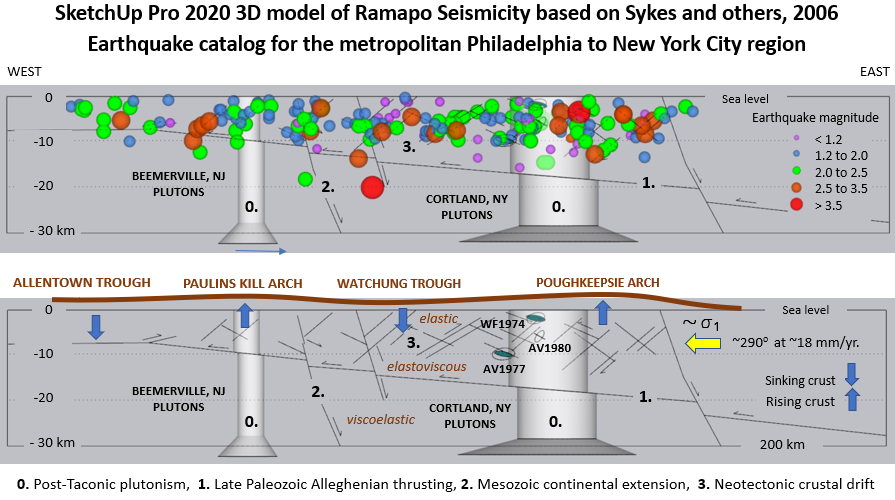
Figure 8.
North, cross-section of the SUP 3D earth model
showing
crustal plutons, crustal
thickness, seismicity, and an interpreted tectonic sequence.
The Cortland (EAST) and Beemerville (WEST)
plutons (Latest Ordovician) widening ad depth into the mantle
beneath the crust at about
30 km depth.
The plutons were likely 1) thrust Westward during the Alleghanian
Orogeny, 2) extended Eastward during Mesozoic Newark rifting, but now,
3) serve as brittle, tectonic buttresses that pin the crust to the
mantle and selectively resist
westward crustal drift. The Ramapo seismic
zone with focused historical seismicity around the Cortland pluton
includes
both NW dipping (antithetic) and SE dipping (synthetic
)
faults in the pluton-intruded basement with associated, rising and sinking regions.
WF1974, AV1977, and AV1980 are events with published focal-mechanism
solutions depicted using oval planes with a 2:1 strike-to-dip aspect.
Green ovals are synthetic faults.
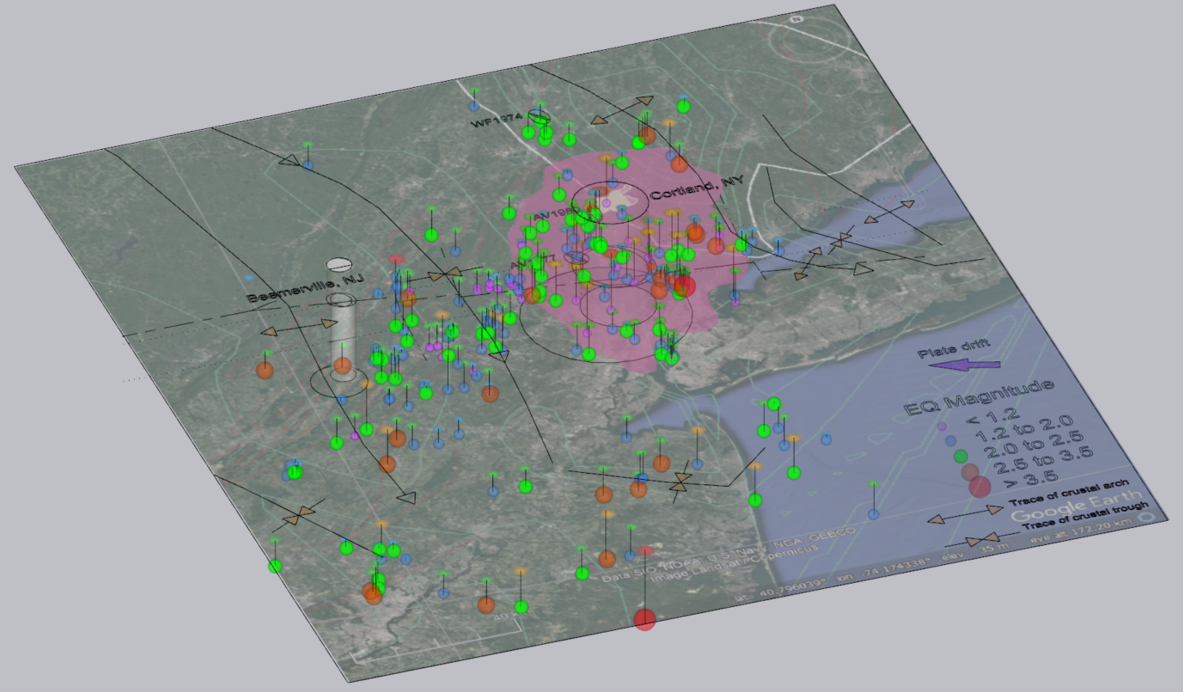
Figure 10.
Oblique NNE view of the 2022 SUP earthquake model for the
New York Recess showing vertical drop lines from mapped epicenters to
each earthquake hypocenter as reported in Sykes and
others (2006). The Ramapo seismic zone is mapped as a pink polygon on
the GE base map.
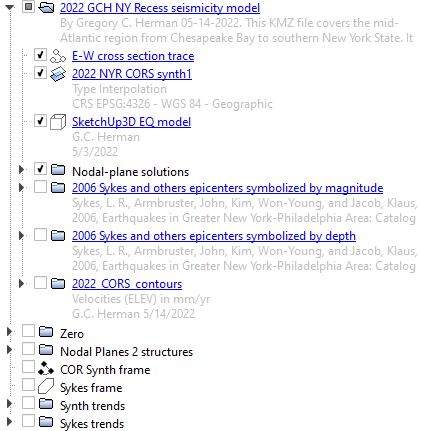
Figure
11.
The contents of the GE KMZ file including the SUP 3D model of Ramapo
seismicity.
See the text for more explanation.
|
Passive drift, wrinkling crust, and cracking
plutons of the New York Recess, USA
Introduction *
Geologic setting * Data and Methods *
Interpretation * Google Earth KMZ
model * References
*
impacttectonics.org
Abstract
A deeper geological
understanding of the manner in which the New York, USA region is drifting and
being slowly wrinkled as
part of the North American lithospheric plate is gained from a neotectonic
analysis using regional geospatial data including geological maps, historical earthquake epicenters, and ground-fixed,
global-positioning-system stations (GPS) that monitor the manner in which our
crust moves.
A review of the prior crustal interpretations
with interpreted seismogenic zones are compared and contrasted with the latest
GPS vertical-velocity maps to illustrate how and why the New York
recess is drifting, rising, and sinking as part of the North American plate (NAP). Focused
earthquake
seismicity occurs where Ordovician plutons preferentially resist crustal drift,
contract, and rise.
Introduction
Geospatial computing, digital mapping, and
computer-aided drafting (CAD) software
provide the means to gather, analyze and communicate the myriad data sets needed
to characterize the subtle neotectonic aspects of a geologically complex region
like the New York Recess of the eastern, passive, continental margin of the North American
tectonic plate (NAP; fig. 1). As is demonstrated herein, geographic information systems (GIS)
and CAD,
including QGIS freeware, the Google Earth (GE) virtual globe, and Trimble
Inc. SketchUp Pro (3D CAD software) are effective tools for
generating and integrating complex, spatially georeferenced themes of crustal
seismicity, geological faulting, and three-dimensional (3D) crustal movements to visually explore subtle links between our current states of crustal
stress and the strain responses, or neotectonic setting.
This work
uses the most recent GPS-based, crustal-motion data together with detailed earthquake-epicenters
catalogs covering the New York and Philadelphia metropolitan area (Sykes and
others, 2006; US National Earthquake Information Center (NEIC, 2015), to generate maps that portray how our crust is
evolving in three-dimensional (3D) detail. These maps are then combined with
regional geology maps including exposed fault traces, Early Jurassic dike
swarms, and glacial moraines to visually inspect the link between plate drift of
a passive tectonic margin and elastodynamic crustal-strain responses down to 20 km depth
that have occurred in the past century.
Geological Setting
This article represents an update to a prior, regional neotectonic study of the
New York Recess as summarized in the annual proceeding
and contributions to the Geological Association of New Jersey (GANJ;
Herman, 2015). That work
also covered the outcropping structural details observed within
different chronostratigraphic units (fig. 2). But the focus here is primarily on
neotectonic movements that have occurred over the past century and includes an updated geospatial-data analyses showing where and why historical seismicity occurs
within our region . The results show remarkable congruity between seismogenic zones
and on-going crustal uplift and subsidence involving deep-seated igneous plutons that serve
as tectonic buttresses that resist
plate drift and focus low-magnitude brittle seismicity around them in
compensatory movements within the upper 20 km of the Earth as the crust is
cracked and wrinkled within the brittle, structural regime (figs. 3 - 5) . As a result,
the pluton cores are contracted and wedged upward in
our current, compressive stress regime. Moreover,
current, vertical movements of our crust include rising and subsiding areas that
are inherited, pull-apart structures that are now being squeezed under a
compressive stress regime as the North American tectonic plate (NAP) rotates
about a pole located in the Southeast Pacific. Our geological provinces
and watershed physiography reflects these dynamics, including far-field strains from the Chesapeake impact of Eocene age
(~35.5 Ma).
The late Cenozoic geological evolution of the middle Atlantic passive
margin is detailed by Poag and Sevon (1989), and Pazzaglia and others (2006).
They report a deeply eroded early Tertiary Appalachian landscape of lower relief
than today. Climate change, epeirogenic uplift, or rapid increase in the size of
the Atlantic slope drainage basin, or some combination of all three factors,
initiated the stripping of mature regolith in the middle Miocene and delivery to
the coastal plain. Increased sediment flux into the Baltimore Canyon trough
(BCT), coupled with erosional unloading caused flexure of the hinged,
continental margin (Pazzaglia and Gardner, 2004). Continued Middle Tertiary
flexural warping of the margin arched early Miocene terraces and contributes to
the continued down cutting of the Susquehanna River channel. The incised Appalachian
landscape now delivers an immature, heterolithic load to the Coastal Plain and
shelf region that reflect both periodic, positive and negative, isostatic
adjustment to the loading and removal of Quaternary continental glaciers, and
slow continental drift on a passive margin. Erosion rates in Susquehanna
River basin reportedly doubled from prior amounts immediately after the
Chesapeake impact at ~ 35.5 Ma based on cosmogenic dating of the oldest river
terraces and associated upland gravel at 36.1 + 7.3 Ma (Pazzaglia and others,
2006). Younger terraces yield dates of 19.8 +2.7 Ma and 14.4 +2.7 ka
respectively. Campbell (1929) mapped the oldest gravels as mantling a
doubly-plunging basement arch referred to as the Westchester anticline that is a
secondary geological structure of Early Tertiary age lying
immediately foreland of Chesapeake Bay (fig. 1).
Steckler and others (1993) estimate a minimum
of 3 km of Cenozoic denudation over the Newark basin and surrounding region based on
fission-track analysis of zircons from both Proterozoic basement and Jurassic
basalts. More recent estimates of up to 6 km of erosion in the piedmont are
reportedly associated with late-stage intra-basin faulting (Withjack and others,
2013). Basal sections of the NJ Coastal Plain of Mesozoic age older than the
Chesapeake bolide impact (35.5 Ma) are likewise compressed, fractured, and
locally folded (Herman and others, 2013; Herman, 2015; 2016). It is likely that
this crustal disturbance also produced a pronounced, post-impact, mid-Tertiary
unconformity in the region (fig. 2). Miocene and younger strata mostly lack any
secondary tectonic structures except in areas in the Delaware coastal plain
(Andres and Howard, 1998) where some of the fastest rates of crustal
subsidence in the area occur (~8 mm/yr.; fig 4). a rate that is almost twice that
reported in the earlier regional study (Herman, 2015).
Data and methods
Three of the geospatial data themes
used in this study were published on line as part of the aforementioned
2015 GANJ meeting. The
earthquake themes are available as customized GE files (KMZ
files) with the methodology and data sources for the geospatial themes summarized
by Herman (2015).
At that time, a NEIC query returned
3532 earthquake events located between longitudes
55oW
to 95oW and latitudes 32oN to 55oN on the North
American tectonic plate (NAP). The events were
parsed into folders having
integer-based magnitude ranges, then displayed using variously colored- and
sized symbols in GE (fig. 5).
A second, more detailed and localized earthquake-epicenter catalog covering the
New York City and Philadelphia metropolitan areas (Sykes and others, 2006) was
used to generate two geospatial themes from 383 event records that range in magnitudes
from 0.2 to 5.2 and depths from 0 to 21 km (fig. 6).
A third GIS theme is a polygon theme representing crustal seismic zones
showing where earthquake occurrences are most prevalent on the North American
tectonic plate (NAP) between latitudes 20°N to 55°N and longitudes 25°W to 105°W
for the period of 1973 to 2001. This theme was built at the onset of a neotectonic
study using a custom, regional, epicenter database built using
different catalogs maintained by the NEIC, 3 US states (NJ OH, IN), and the
Weston Observatory at Boston University (Herman, 2006). That database had 28,139 epicenter
records for the period 1900 to 2005 after combining and parsing to eliminate duplicate
events. The resulting point theme included 27,852 epicenters having
magnitudes 2.0
to 7.3, with 26,625 of those also having recorded depth values.
This point theme was used to generate the seismic zones
included here. The
process then involved using ArcView Spatial Analyst software to rasterize the point
theme and populate 0.1-degree
cells with calculated earthquake-epicenter density values. The densities were
calculated by sequentially querying the number of events lying within a 50 km
search radius from the center of each
cell. A set of polygons
representing crustal seismogenic zones were generated as isolines from the
raster theme by enclosing areas
having epicenter densities greater than 0.001
earthquakes per sq. km. These values were derived and symbolized using trial and error
densities, search radii, and grid-cell sizes. This work was completed shortly
before the work of Sykes and others (2006) was published.
A fourth geospatial theme used here is GPS data known as
CORS; continuously operating receiving stations, that are coordinated and
maintained by the U.S. National Oceanic and
Atmospheric Association. Each monitoring station is grounded and reports derivative
crustal motions along directions parallel to longitude (X) and latitude (Y), and
normal to Earth's surface (Z). The CORS Zvel theme included here was generated
using
396 of the 2405 total CORS stations in the
conterminous United States.
Station data were downloaded and processed from degree, minute, and second
coordinate format of the 1984 world geographic system (WGS1984) to decimal-degree
coordinates.
QGIS (rev. 3.16.14) computer software was used to generate a
raster theme covering a region from longitudes 82.2o to 69.2oW
and latitude 34.5o
to 44.7o N
(fig. 1).
The vertical-derivative values of plate motions were interpolated
between adjacent points (GPS stations) to map the differences in vertical ground motion in
the area using ~.05-degree cells and a yellow (positive or up) to blue (negative
or down) color scheme (figs. 1 and 4 to 6). The raster image was therefore generated
using QGIS, captured as a visual display, saved as a PNG graphics file, and georeferenced in
GE in order to assess the spatial nature of the different rising and subsiding
regions with respect to the seismogenic zones and geological features mapped at
Earth's surface. The colored image is a single band, raster, linear-interpolated theme that displays the
vertical-velocity (Zvel) field by highlighting areas that are rising and sinking
according to the GPS data.
A
set of velocity contours at 0.5 mm/yr. intervals was also generated using the
raster theme. The
resulting subset of isolines equaling zero (0.0) velocity were highlighted in order
to show the boundary between currently rising and subsiding areas within the
region.
Interpretation
A SketchUp Pro (SUP) 3D crustal model was built using
both magnitude- and depth-based GE displays of Sykes and others (2006)
earthquake catalog and the Zvel raster image as base maps. The igneous
plutons are modeled in three dimensions (3D)together with 243 earthquakes having
both depth and magnitude parameters in the catalog (figs. 6 to 9). The model includes points, lines, and
polygons components that were manually added into the model in order to gain a visual perspective on the rheological and spatial controls associated with the
earthquakes.
In the SUP model,
I portray both the Cortland (NY) and Beemerville
(NJ) pluton complexes as inflating beneath the base of the crust, assumed to be
about 30 km thickness based on nearby, deep, seismic-reflection profiling
of the New Jersey Coastal Plain Atlantic shelf (Sheridan and others, 1991; Herman, 1992).
The geological nature of the Cortland igneous plutonic complex is
discussed in detail by Merguerian (2008).
It's a complex amalgamation of intrusive plutons of mantle
origin with mafic to granitic phases that outcrops within a circular area of about 8 km radius
(figs. 6 and 7). It's portrayed in the model as a cylindrical plutonic complex
of constant diameter within the crust that expands outward beneath it in the
uppermost mantle to portray ponding of magma beneath the crustal base. This is a
simple form, and does not reflect the upward-expanding conical shape of some of
the individual plutons and any unknown complexities like plume coalescence
and cross-cutting in the deep subsurface, or their relationship with crustal
faults.
The Beemerville intrusion is also represented as
a vertical, cylindrical body but with a comparatively smaller-diameter
(~6 km). Its subsurface geometry is modeled using gravity and magnetics by Ghatge and others (1992),
and its structural profile by Drake and others (1996) and Herman (1997). It's also of Latest Ordovician age
and is located about 57 km to the WSW of the Cortland plutons in the Valley and
Ridge province of northern New Jersey.
Earthquake P-axis solutions summarized by Herman
(2015) are included in figure 6. Also, three other earthquakes having focal-plane solutions
in the Ramapo seismic zone are reported by
Seborowski and others (1982) for the period 1974 to 1980.
Two are located near Annville, NY and the other, Wappinger Falls, NY, with both
near the Hudson River and within 60 miles of New York City. They
are all low-magnitude events (1.5 and 2.8 mblg) with
reported depths of 1 km. Their respective focal mechanism solutions include the
following fault planes:
1) Wappingers Falls (1974) N40oW/30oE
and N40oW/60oW,
2) Annsville 1 (1977) N34oW/26oNE
and N58o/66oW, and
3) Annsville 2 (1980) 2oW/29o
E and N16oW/62oW.
All three solutions have gentle, east-dipping
fault planes, and steep, west-dipping ones as summarized in cross section in
figure 8.
As mapped,
the Cortland plutons outcrop in the center of the
northern half of the Ramapo seismic zone (fig. 5) but the structural
form of the plutonic complex at depth is unknown. A primitive, cylindrical
pluton form is assumed for this model (fig. 8).
The crust is most wrinkled from recent strains immediately to the south of the
plutons as it drifts toward azimuth 290o
(figs. 5 and 6).
The Cortland plutons together with sister
plutons of the New Jersey Beemerville intrusive suite form the cores of
neotectonic crustal arches that have an intervening trough striking about north-south
between them, here designated the Watching trough, because its lateral
boundaries are defined by the Watchung syncline in the Newark Basin where Jurassic lava
flows and sedimentary beds sag downward along the Ramapo border fault (fig. 6). N-S trends of seismicity
are focused on the western side of this structure where inherited, late Mesozoic pull-apart structures developed
under tension but are
now being compressed and inverted in our contemporary, compressive stress regime
(Herman, 2009).
The Ordovician plutons appear to locally weld the crust to the underlying mantle, thereby
focusing brittle and elastoviscous crustal adjustments around them. The plutons
impart a local rheological contrast in the crust signaled by the earthquake
swarms surrounding it and thereby causing the Ramapo seismic zone.
The chronologic sequence of geological events
involving the Cortland and Beemerville intrusions after emplacement near the end of the Taconic
Orogeny therefore includes at least three, subsequent tectonic episodes:
1) Late Paleozoic contraction and thrusting of the New
York recess bedrock northwestward during the Alleghanian orogeny and final
suturing and assembly of Pangaea,
2) Newark extension and normal faulting of the continental margin
during the Mesozoic era that stretched and
offset all earlier
structures, and finally
3) Contemporary, post-inversion drift involving compressive brittle cracking
of the intruded foreland, and lithospheric drift towards azimuth 290o.
When the polarity reversal of the regional state of crustal stress flipped
from principal tension during Newark rifting to subsequent compression that
continues today is speculative. One interpretation is that compression began
during the Mid Jurassic during the 'rift-to-drift transition' when the
mid-Atlantic Ridge was born. Upwelling, active magmatism beneath opening
segments of oceanic ridges thermally welted the crust and provided both
gravitational and tractive pushes (Schlische and others, 2003). But another
option is that the polarity switch came after the Nemesis bolide impact at the
Cretaceous-Tertiary boundary (~66 Ma) when the Chicxulub crater was excavated on
the south rim of the Gulf of Mexico. Systematic, tensile fracturing of Mesozoic
bedrock in the Newark Basin reflects clockwise rotation of the North American
tectonic plate during the breakup of Pangaea (Herman, 2009). But now, the plate
is rotating counterclockwise about a pole located west of Ecuador in a location
within the East
Pacific Nazca plate (Herman, 2005).
A 'stable-craton' rotation pole for the NAP is located more northward around
Panama, closer to the Chicxulub crater. In total, the South, Central, and North American lithospheric plates
drift in concert around
a Chicxulub hub
even though today's plate-rotation pole for the NAP isn't near the crater. Nevertheless,
oceanic transform faults in the floor of
the northwestern Atlantic Ocean basin show a geometry change from concave to
convex at about the ~66 Ma magnetic isochron (Herman, 2009) that reflects a wholesale rotation
change of the plate shortly after impact, as if the event and associated
astrobleme pinned the crust to the mantle, thereby setting up a new geodynamic system that
most to
dispel the newly introduced energy flux that is also marked by a key bed coinciding with a
major biological extinction event at the Era boundary.
We also don't know if crustal drift differs from mantle drift. That is,
does the entire lithosphere moves as a lithic block, or is it subject to
vertical differences in drift speeds with simple-shear profiles determined by vertical rheological
contrasts? Lateral
variations of plate drift of the NAP reflect increasing angular velocities with increasing
distances from the rotation pole (Herman, 2006). I suspect that shearing a plate
from drift would reflect the opposite trend
having minimal velocities occurring at the surface that increase with depth. It's
difficult to imagine an opposite scenario where the crust moves faster than the mantle,
because the crust is relatively thin and brittle in comparison with the stiffest material lying closest to
Earth's surface
where the maximum resistance to lateral drift occurs.
Beneath the crust, things strain viscously (fig.
3). Historical seismicity shows brittle failure
occurs principally above 20 km depth, but lithospheric plates beneath
continents can vary from 100 to 200 km. Therefore, the nature of drift in the elastoviscous and
viscoelastic layers below the crust are unknown owing to the lack of measurable seismic responses to flow. If a vertical-velocity gradient exists, then
two
possibilities are that the mantle
would either move forward (NW) or backward (SE) relative to the crust. Lacking
a vertical gradient, the third
option is that the bulk lithosphere drifts laterally at the same speed. But this latter option seems
unlikely because temperature, pressure, and
geochemical gradients occur at depth, and to assume a constant velocity therefore
is
anomalous.
Pondering these options is what drove me
to build the
SketchUpPro model of the mantle plumes. After having built it, it now
appears that the primary motivating factor behind plate drift is the lateral
push
exerted on the base of the lithosphere by upwelling, very large mantle plumes
rising off Earth's outer core, the largest of
which under Africa is tilted in the direction of plate drift. But I still don't know
if their is a varying
drift profile of the NAP in the New York recess. It's reasonable to assume that
in some places there will be a vertical drift gradient within the
lithosphere, particularly in areas of focused seismicity, but in other places the
crust and associated lithosphere may drift as a single, rigid block. But having focused, brittle seismicity associated with the
Ordovician plutons in the mid-Atlantic Appalachian region spurs me to think that
the crust is dragged along the top of a drifting lithospheric plate that's
getting pushed about, but with local pockets of resistance. After all, the Earth is cooling from the inside out and associated
kinematic movements should likewise, generally decrease outward.
Google Earth KMZ file
A GE KMZ file including the Zvel raster theme, the
SUP seismicity model, the Cortland and Beemerville
plutonic complexes, and an E-W cross section summarizing neotectonic structures
is available as a
free
download. The contents are outlined in figure 10.
Most of the contents of this file are detailed above,
but it also contains two additional folders holding interpretations of seismic
lineaments. These are polyline interpretations of the strike of secondary
structures indicated by the systematic alignment of earthquake epicenters with
neotectonic crustal arches and troughs. These features are highly speculative
and are intended to highlight linear trends along which the crust is failing
with brittle strains occurring above 20 km depth.
References
Drake, A. A., Jr., Volkert, R. A., Monteverde, D. H., Herman, G. C.,
Houghton, H. F., Parker, R. A., and Dalton, R. F., 1996, Bedrock
geological map of northern New Jersey: U.S. Geological Survey Miscellaneous
Investigation Series Map I-2540-A,
scale 1:100,000, 2 sheets.
Ghatge, S. L., Jagel, D. L., and Herman, G. C., 1992,
Gravity
investigation to delineate subsurface geology in the Beemerville intrusive
complex area, Sussex County, New Jersey:
N.J. Geological Survey Geologic Map 92-2. 1:100,000 scale.
Herman, G. C., 1992,
Deep crustal structure and
seismic expression of the central Appalachian orogenic belt:
Geology, Vol. 20, No. 3, p. 275-278
Herman, G. C., Monteverde, D. H., Schlische, R. W.,
and Pitcher, D. M., 1997, Foreland crustal structure of the New York recess,
northeastern United States: Geological Society of America Bulletin, v. 109, no.
8, p. 955-977.
Herman, G. C., 2006,
Neotectonic setting of the
North American Plate in relation to the Chicxulub impact:
Geological Society America Abstracts with Programs, Vol. 38, No. 7, p. 415 (1.3
MB PDF file)
Herman, G. C., 2009,
Steeply-dipping extension
fractures in the Newark basin (5
MB PDF), Journal of Structural Geology, V. 31, p. 996-1011.
Herman, G. C., 2015,
Neotectonics
of the New York Recess, in Herman,
G. C., and Macaoay
Ferguson, S., Neotectonics
of the New York Recess: 32nd Annual proceedings and field guide of the
Geological Association of New Jersey, Lafayette College, Easton, Pa., p. 80-151
Merguerian,
C.,
2008, Cortland Igneous Complex, Buchanan, New York: Guidebook notes for
Geology 133 Field Trip 21 April, 2008, Hofstra University. 42 p.
Pazzaglia, F. J., Braun, D. D., Pavich, M., Bierman,
P., Potter, N., Jr., Merritts, D., Walter, R., and Germanoski, D., 2006, Rivers,
glaciers, landscape evolution, and active tectonics of the central Appalachians,
Pennsylvania and Maryland, in Pazzaglia, F.J., ed., Excursions in
Geology and History: Field Trips in the Middle Atlantic States: Geological
Society of America Field Guide 8, p. 169–197, doi: 10.1130/2006.fld008(09).
Poag, C. W. and Sevon, W. D. 1989. A record of
Appalachian denudation in post rift Mesozoic and Cenozoic sedimentary deposits
of the U.S. middle Atlantic continental margin: Geomorphology v. 2: p. 119–157
Schlische, R. W., Withjack, M. O. and Olsen, P. E.,
2003, Relative Timing of CAMP, Rifting, Continental Breakup, and Basin
Inversion: Tectonic Significance, in The Central Atlantic Magmatic Province:
Insights from Fragments of Pangaea (eds. W. Hames, J. Mchone, P. Renne and C.
Ruppel). https://doi.org/10.1029/136GM03
Sheridan, R. E., Olsson, R. K ., and Miller, J. J., 1991, Seismic reflection and
gravity study of proposed Taconic suture under the New Jersey Coastal Plain:
Implications for continental growth: Geological Society of America Bulletin, v.
103, p. 402-414.
Seborowski, K. D., Williams, G., Kelleher, J. A., and Statton, C. T., 1982,
Tectonic implications of recent earthquakes near Annsville, New York,: Bulletin
of the Seismological Society of America, v. 72, no. 5, p. 1601-1609
Sykes, L. R., Armbruster, John, Kim, Won-Young, and Jacob, Klaus, 2006,
Earthquakes in Greater New York-Philadelphia Area: Catalog 1677 to 2005 and
Tectonic Setting; Appendices to paper Earthquakes in the Greater New York
City-Philadelphia Area: 1677-2004.
This blog entry is dedicated to my father, the
late Donald Edward Herman, whose birthday in 1930 was on the same May day that
this entry was completed.
Abstract *
Introduction *
Geologic setting * Data and Methods *
Interpretation * Google Earth KMZ
model * References
* References
*
impacttectonics.org